Spatial analysis, GeoAI and maps, each shown beside real work
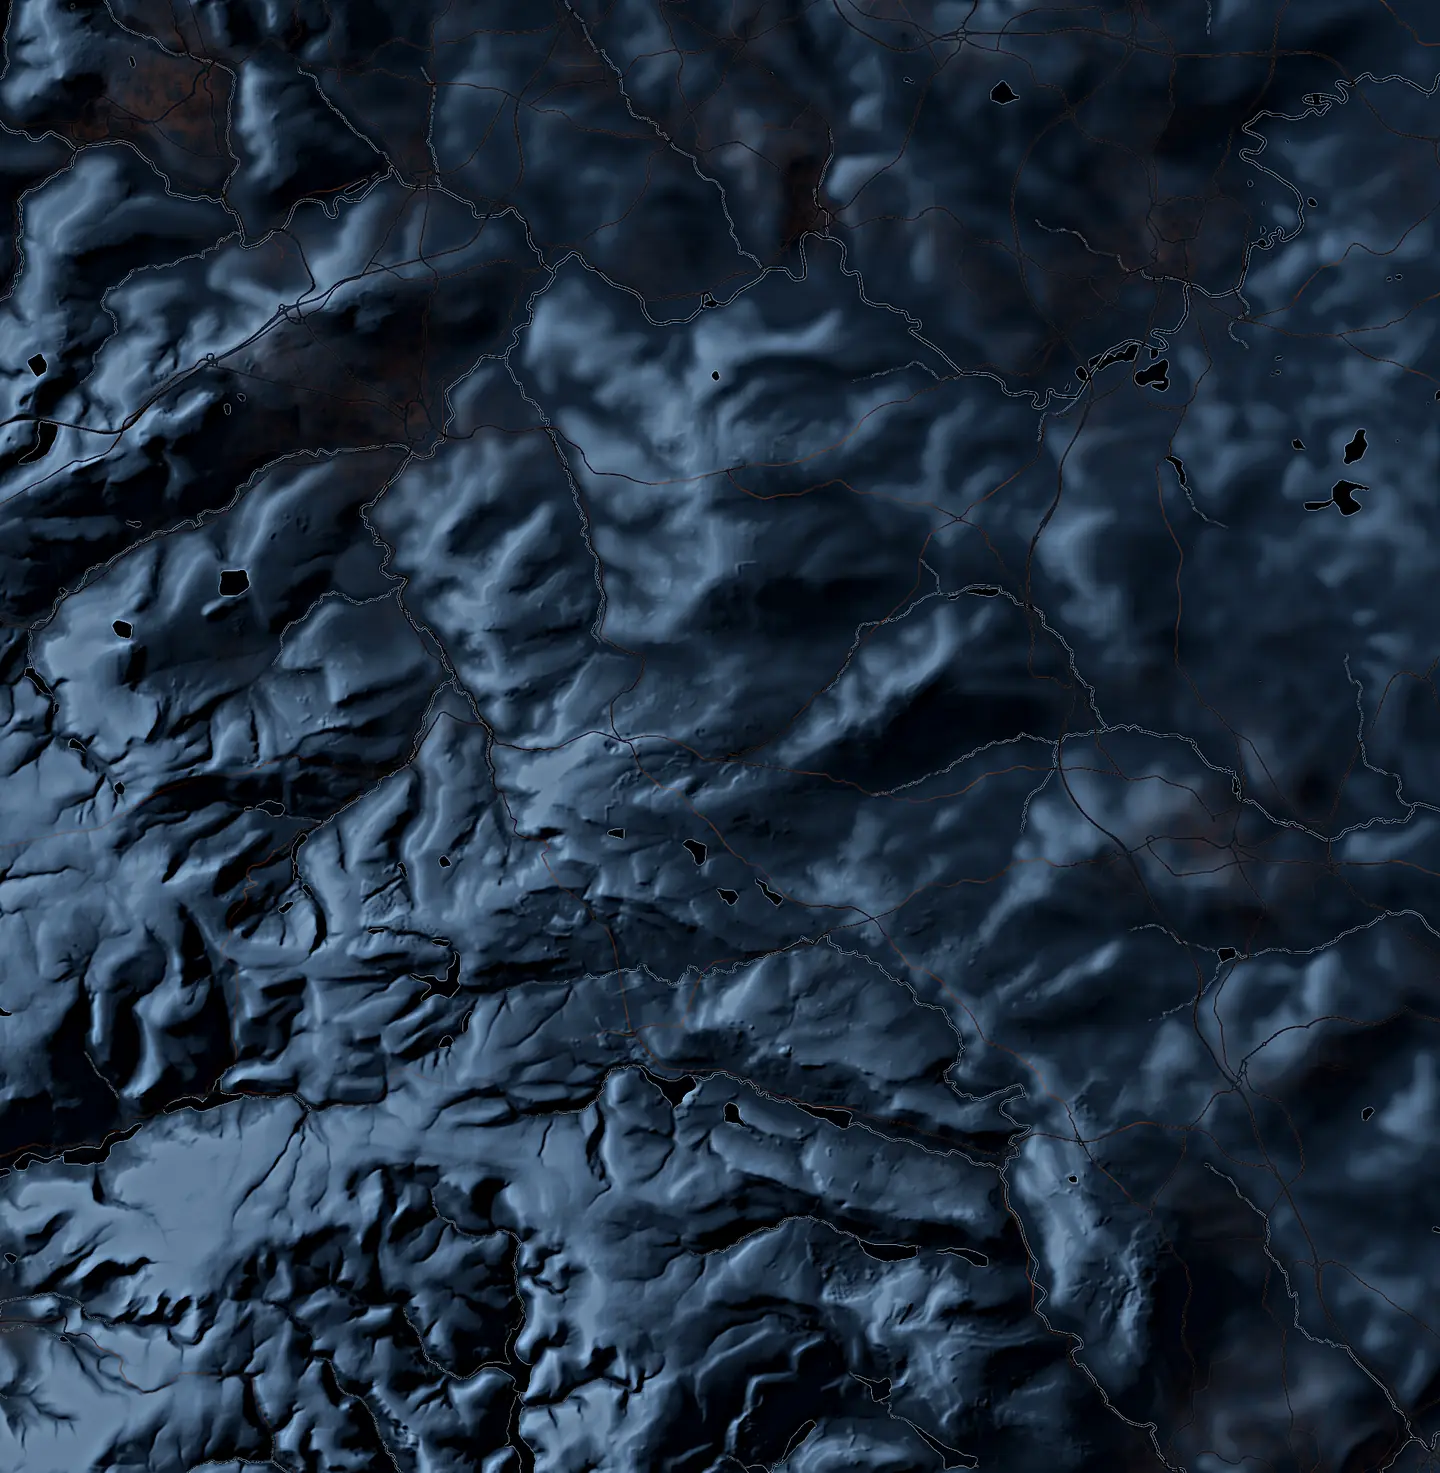
The moors east of Manchester, drawn for this site. Data: Copernicus
If you have a question about a place, or data you think could answer one, that's the kind of work Spatial Nexus takes on. AI systems I've built and run do the analysis and the mapping, while I direct what they do and take responsibility for the result.
Tell me about your projectSpatial analysis
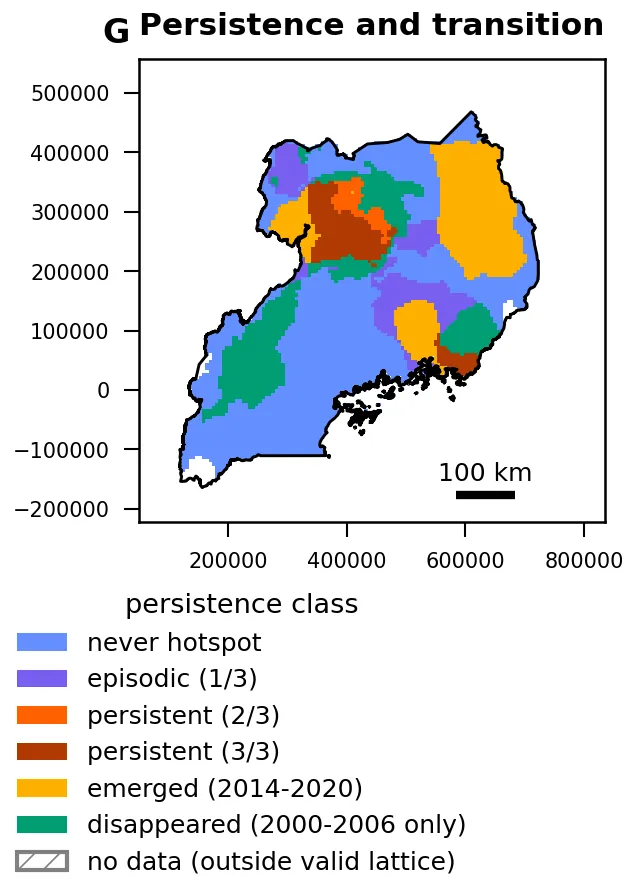
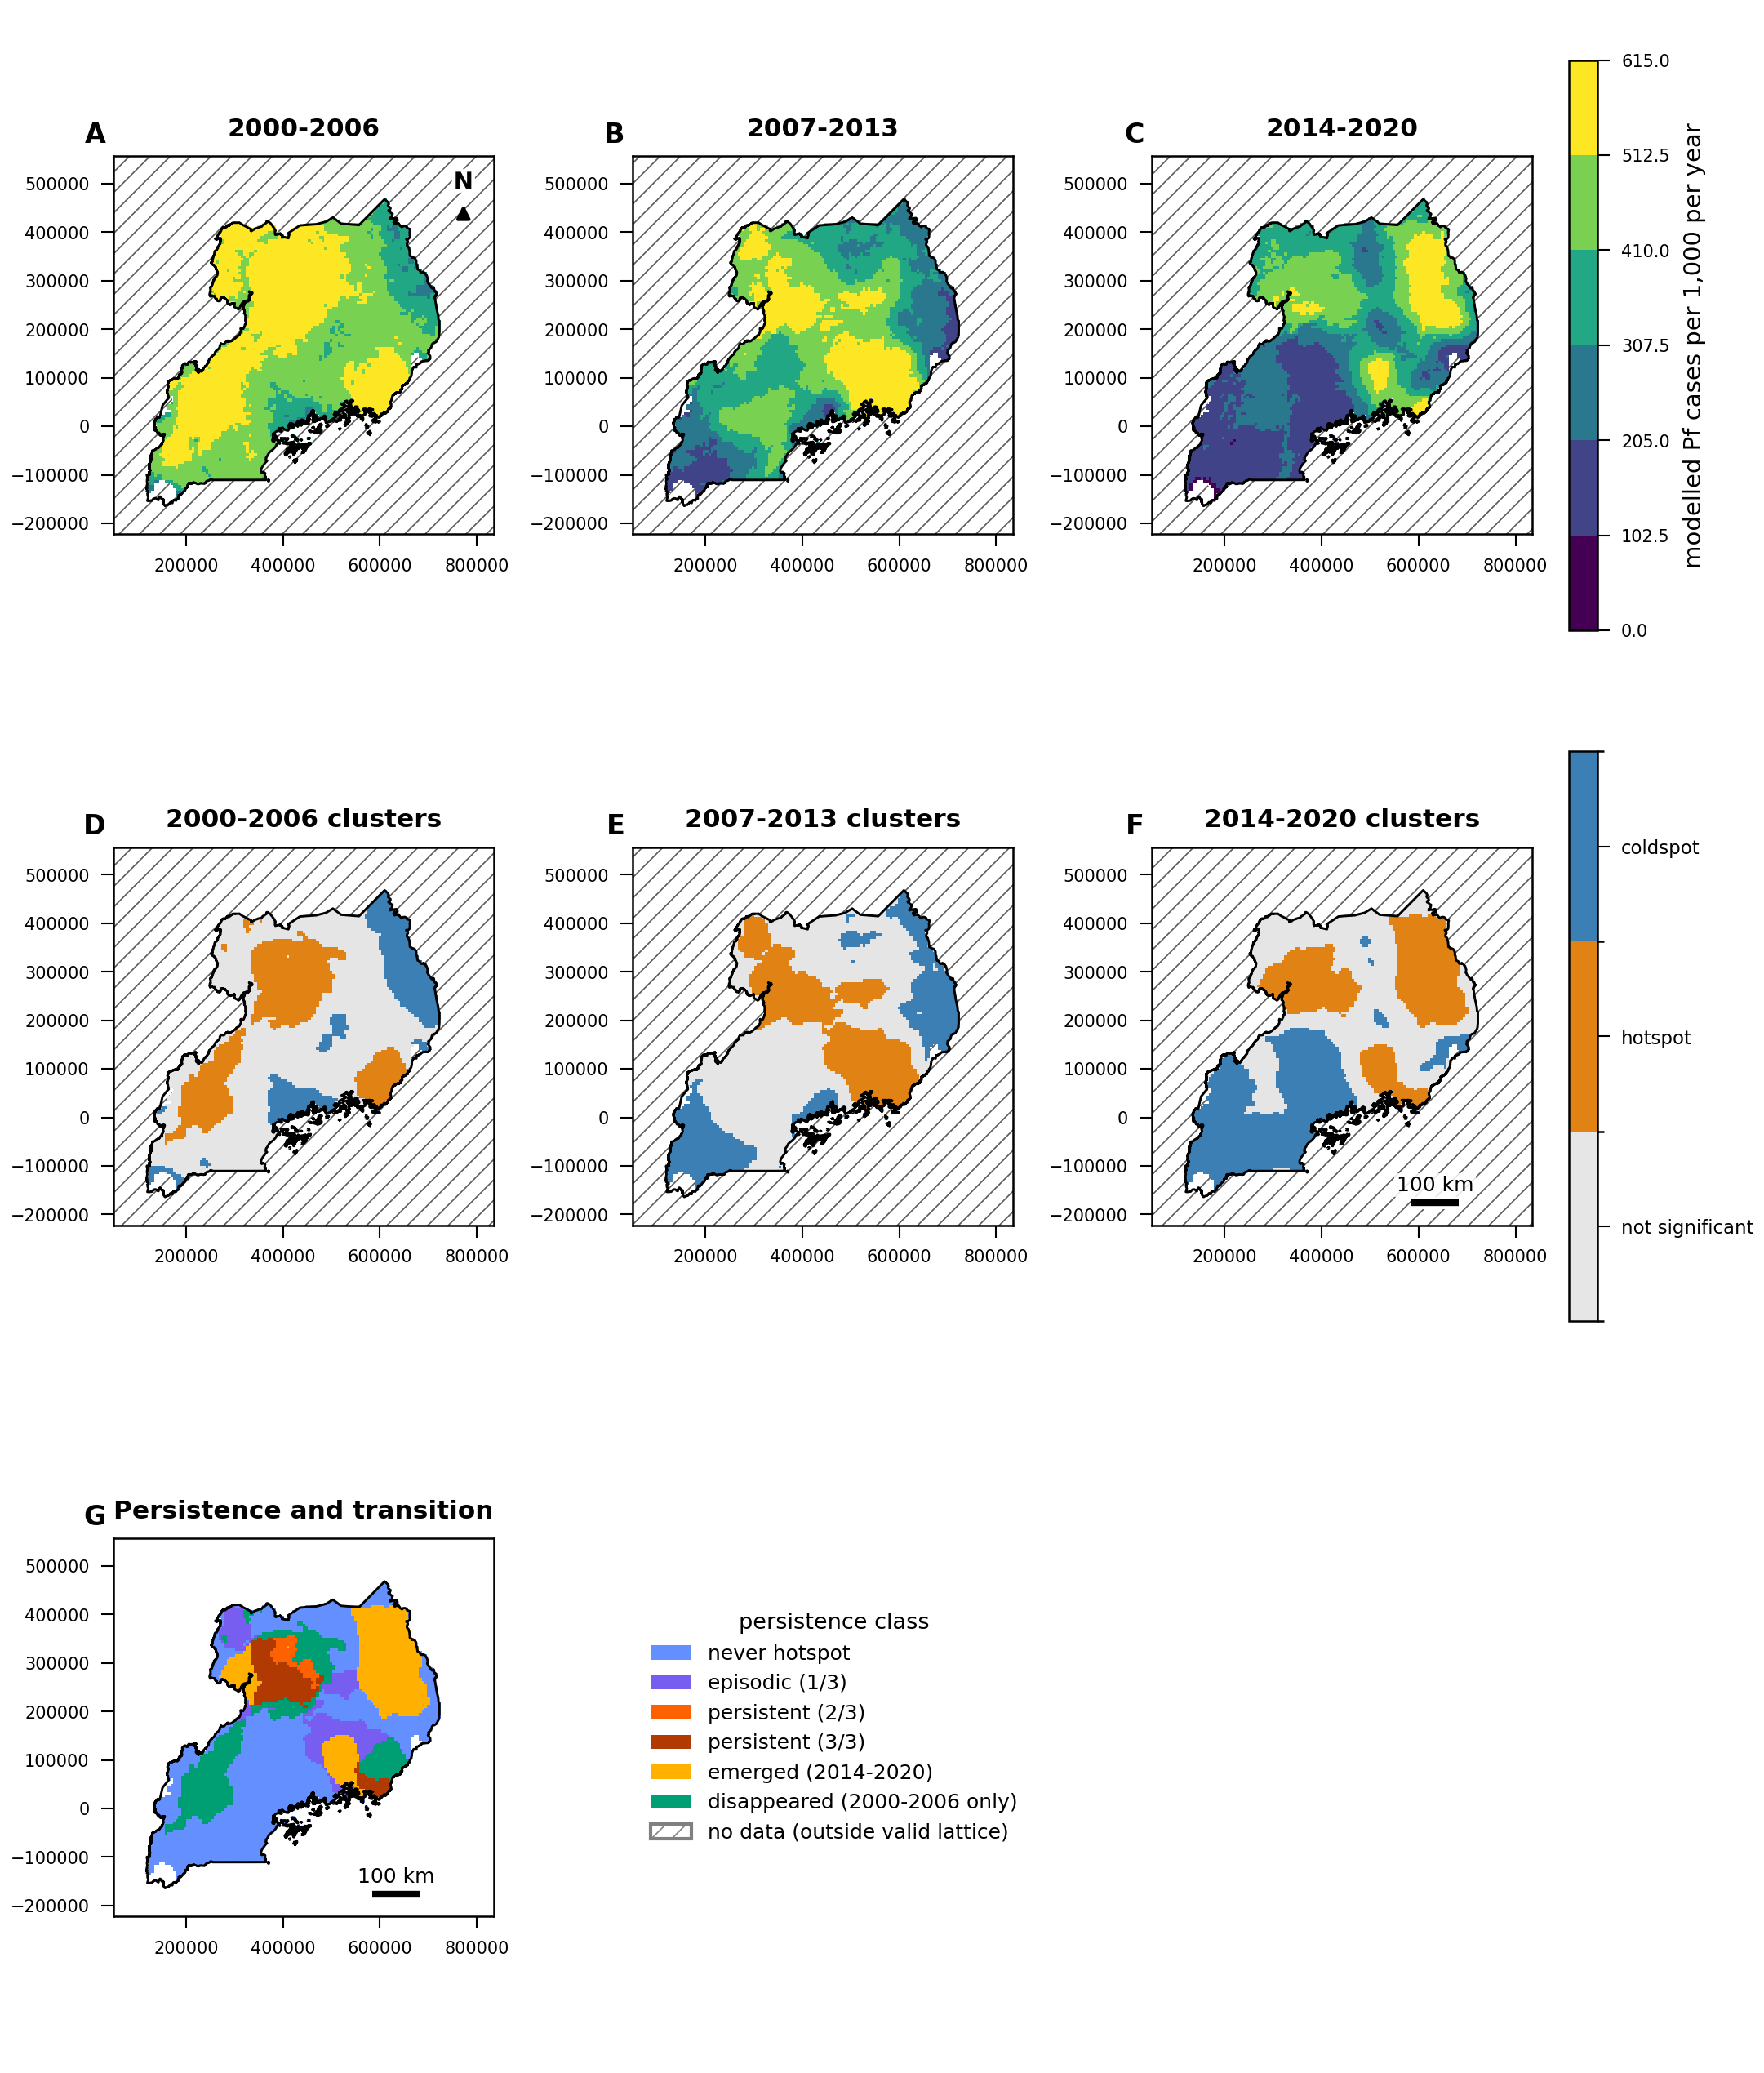
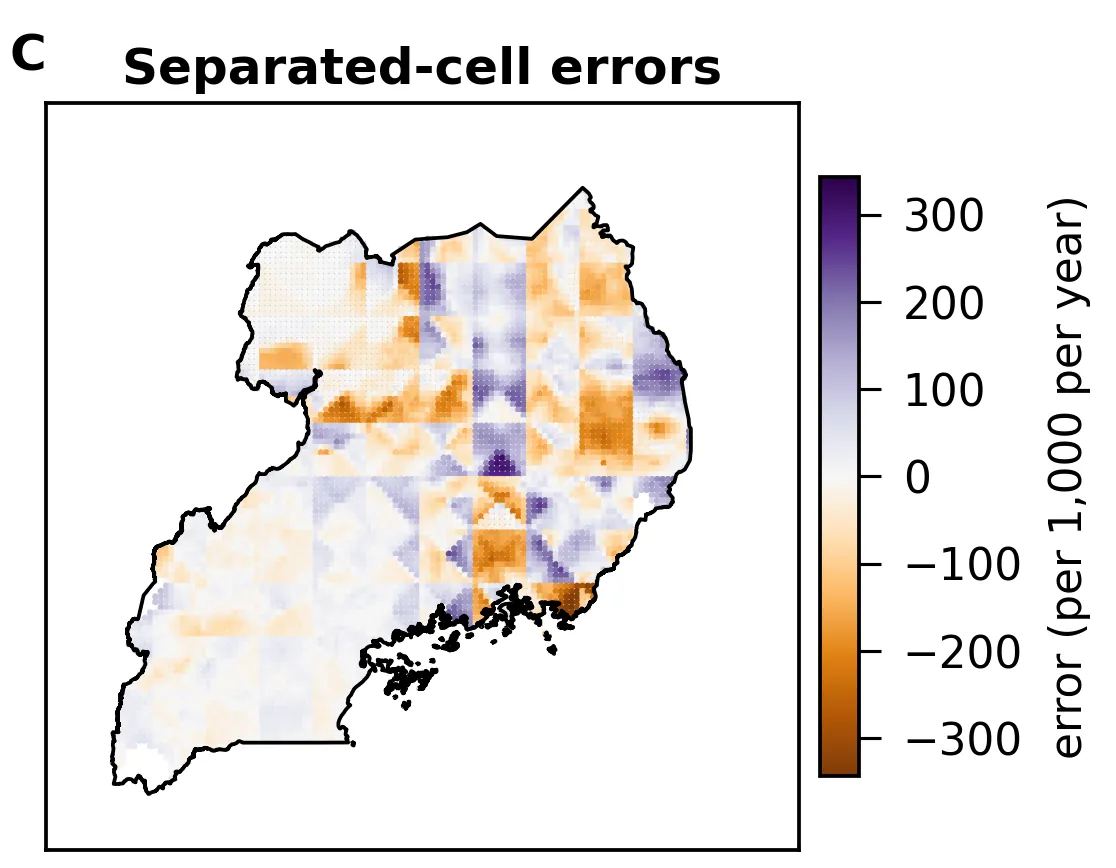
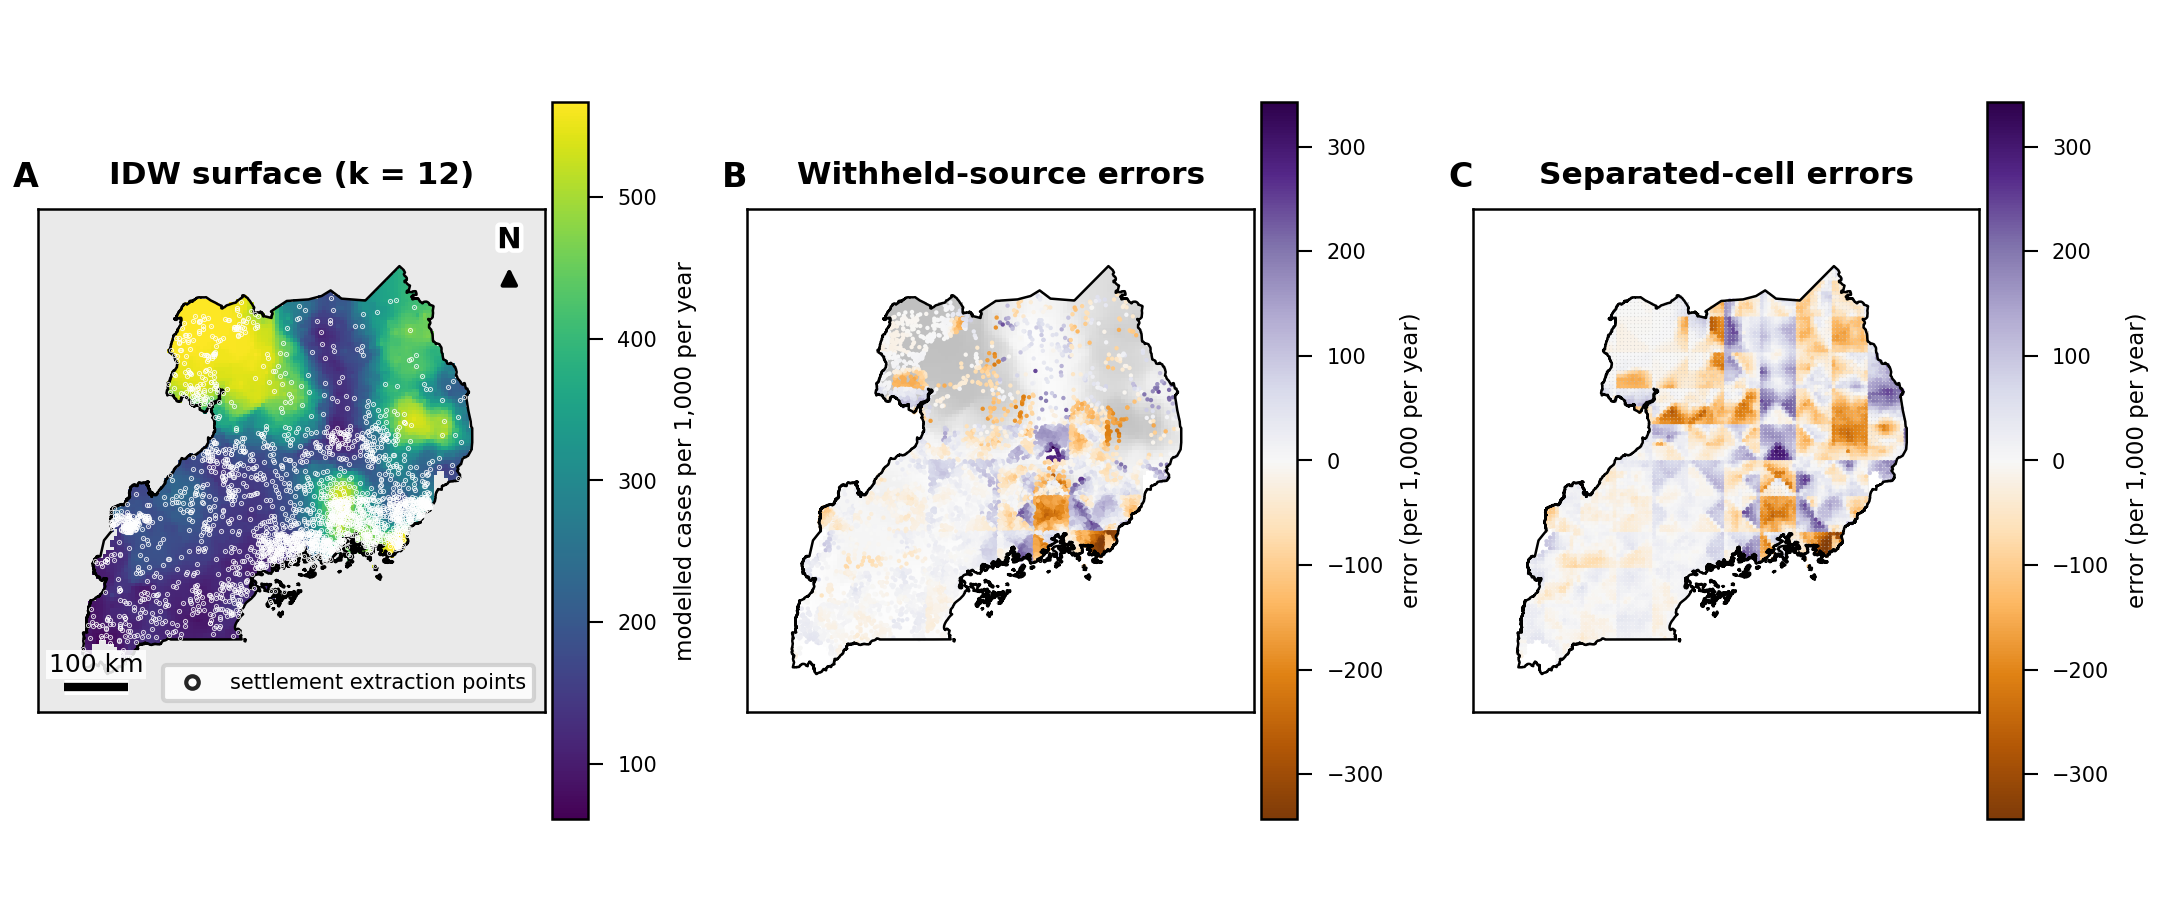
Spatial analysis tells you what changed, where it changed and how sure you can be of the answer. In the work on this site that meant gridded surfaces, census and boundary data, and climate and land-cover products. In the Uganda study the uncertainty sits next to the main results.
What this can look like (methods used in the work shown on this site):
- trends over time, with intervals that allow for year-to-year dependence (Theil–Sen slopes with block bootstrap);
- hotspots and whether they persist (Getis–Ord Gi*, compared across periods);
- how an outcome relates to temperature, water or land cover, adjusted for other factors (generalised additive models), reported as associations;
- checks on your own maps: rebuild a surface from known points and measure the error where the reconstruction never looked (inverse-distance interpolation).
In the Uganda study, run end to end by ATLAS, Spatial Nexus's AI research system, the Eastern and Northern regions have 26.00% of their land in persistent malaria hotspots, where Central and Western have 7.52%. The study also shows how much that gap depends on the method.
GeoAI and applied AI
This is where an AI system does the analysis and the research, and the test is whether you can check what it did. In the Uganda study that meant each number shown could be followed back to the data and the step that produced it, and the limits were written down with the findings.
What this can look like:
- an analysis run by AI under rules fixed in advance, with every displayed number re-checked against its source before you see it;
- specs or other documentation that the people you're writing for can interact with (what OKF-Loom v2 lets you do).
ATLAS runs geospatial research studies end to end. It produced the 26-page Uganda study, with 286 numbers each re-derived and matched and 43 citations verified.
OKF-Loom v2 is open source, and anyone can use it to help with their documentation.
Can it run on our data and infrastructure?
The Uganda study ran only on public data, from 16 public sources, so I can't point to it as proof of running on yours. Whether an analysis like it can run on your data, and where, is the first thing we'd settle when we talk, and I won't promise more than that until we have.
What would a first piece of work be?
I'd suggest starting with one question and your data, and ending with a written result that states its checks and its limits. I'd quote for it after a first conversation.
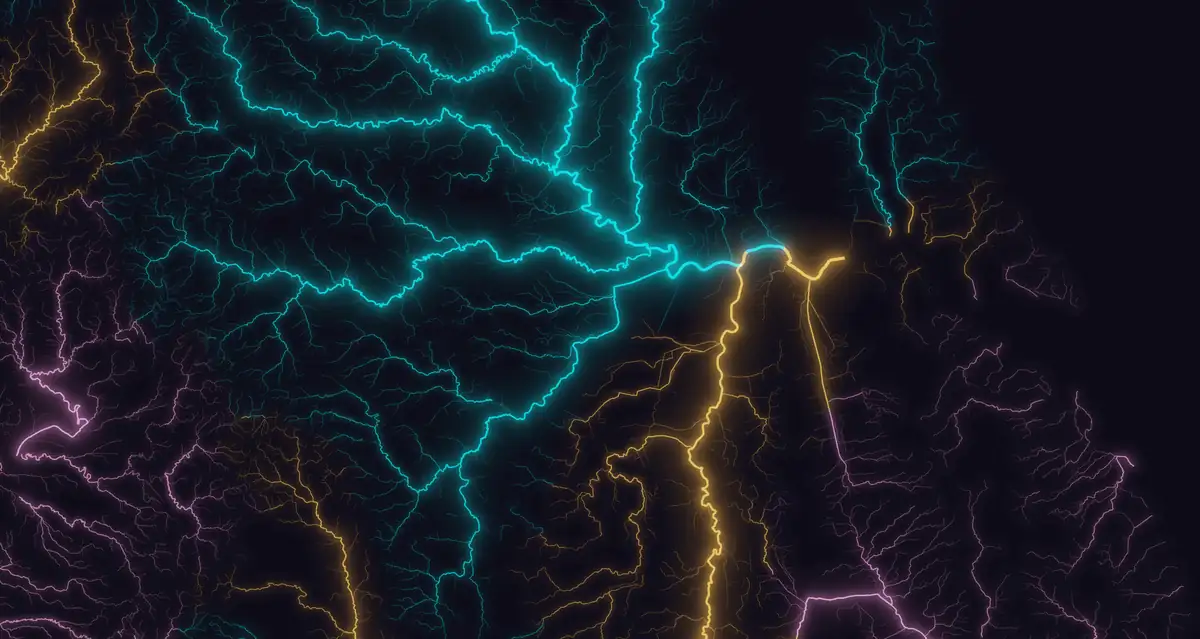
Maps and data graphics
The maps I show here each start from one question and answer it in numbers, and they name the data those numbers came from. The colours on both were checked for common types of colour-vision deficiency.
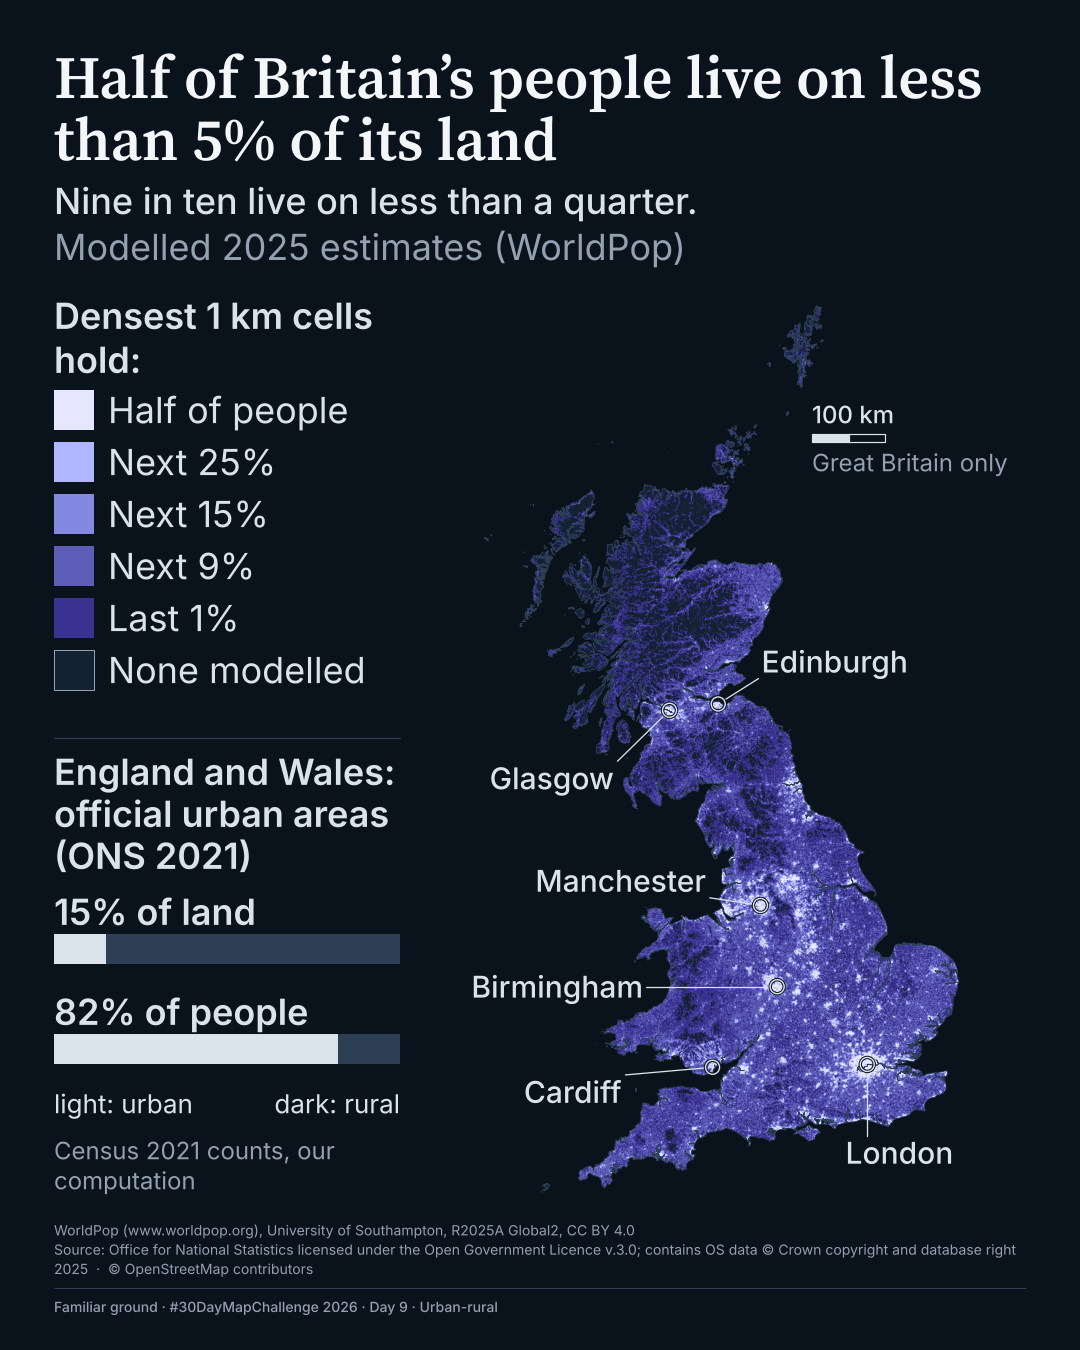
Two maps from the #30DayMapChallenge in November 2026 show this, one on where Britain's people live and one on how close Manchester's residents are to a park, both made by Moxi, Spatial Nexus's cartographer, with ATLAS. The Uganda study figures on this site, which ATLAS produced, name their data in the same way.
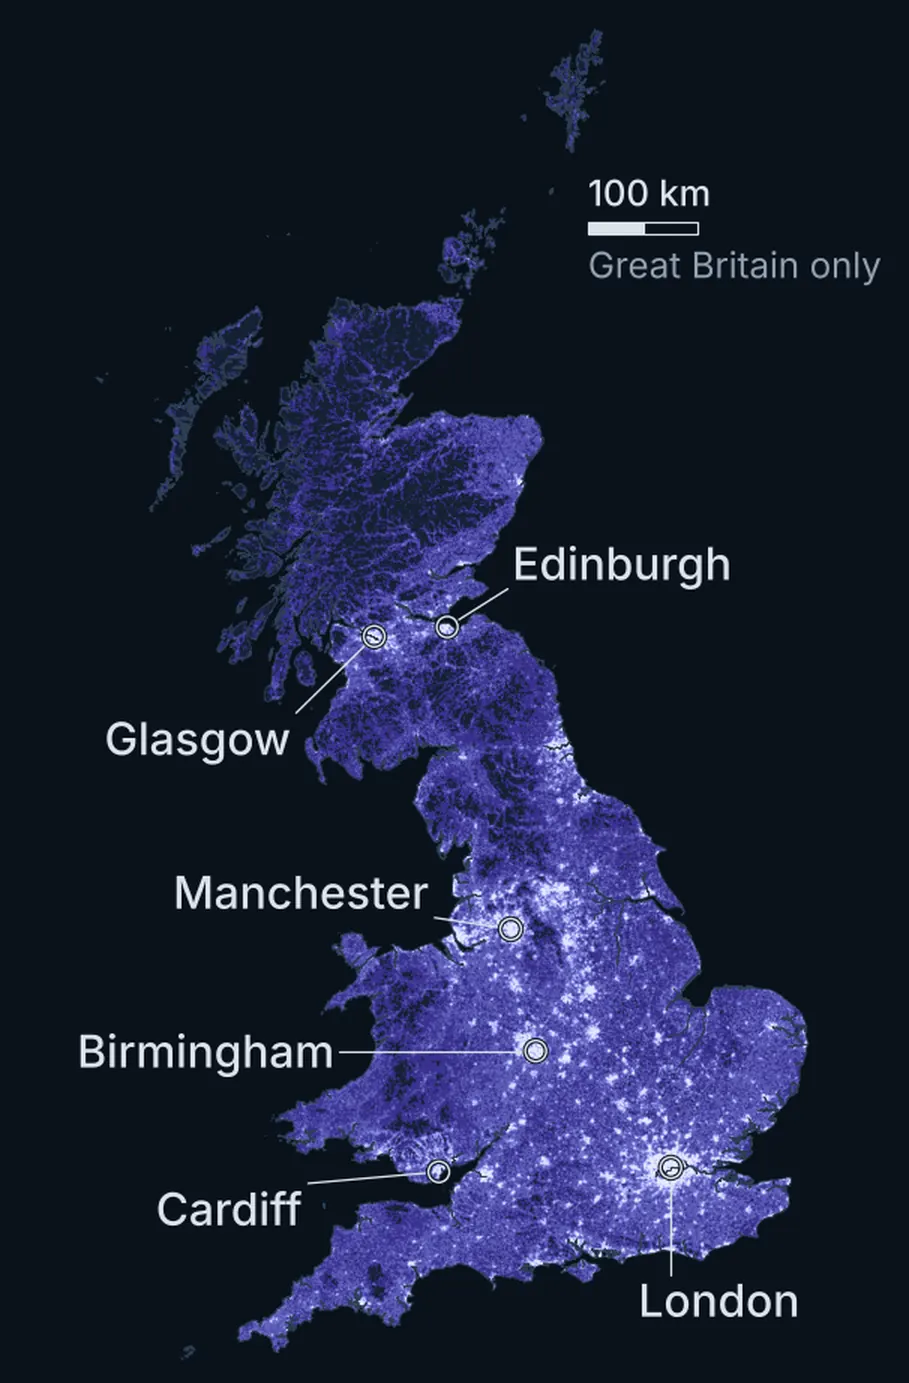
Half of Britain's people live on less than 5% of its land. #30DayMapChallenge 2026, Day 9.
Made by Moxi at Spatial Nexus, with ATLAS.
Data and credits
Data: WorldPop (www.worldpop.org), University of Southampton, R2025A Global2, CC BY 4.0. Source: Office for National Statistics licensed under the Open Government Licence v.3.0; contains OS data © Crown copyright and database right 2025. Source: Office for National Statistics (Census 2021, TS001), licensed under the Open Government Licence v.3.0. © OpenStreetMap contributors.
How can we work together?
A project: one question and an agreed scope, ending in a written result that lists its sources, its checks and what the data couldn't support.
Ongoing support: analysis, maps or AI work as your questions come up, over a period we agree.
Training: working through these methods and tools with your team, on your own data.
What does it cost?
Each piece of work is quoted after a first conversation. I don't publish prices, because the cost depends on the question, the data and the deadline. Tell me those and I'll tell you what it would cost.
What happens after I get in touch?
- You tell me what you need by email.
- I reply by email. If you'd like a call, I'll suggest times.
- We talk it through. If it's work I can take on, I send you a quote.
What I don't take on
- land or engineering surveying, and field data collection;
- reselling software licences;
- work that needs sign-off from a chartered or regulated professional;
- general IT, cloud or systems work.
Sources and credits
- The moors east of Manchester
- Produced using Copernicus WorldDEM-30 © DLR e.V. 2010-2014 and © Airbus Defence and Space GmbH 2014-2018 provided under COPERNICUS by the European Union and ESA; all rights reserved. Contains OS data © Crown copyright and database rights 2026. © OpenStreetMap contributors.
- Uganda's terrain
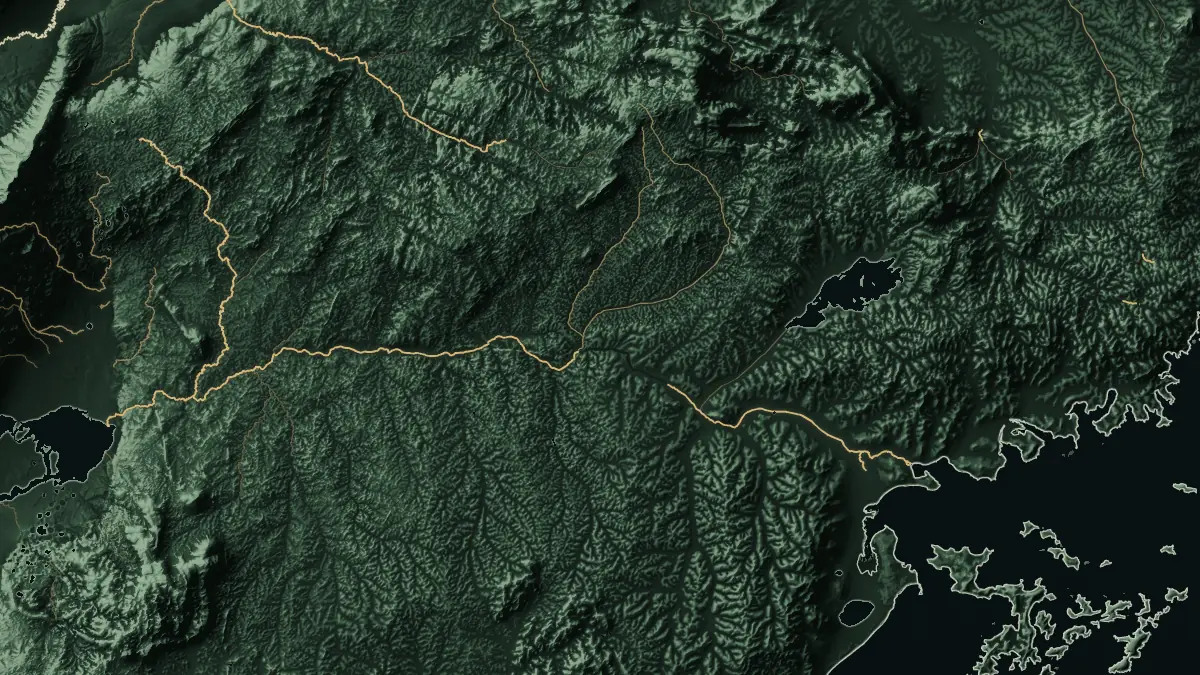
- Produced using Copernicus WorldDEM-90 © DLR e.V. 2010-2014 and © Airbus Defence and Space GmbH 2014-2018 provided under COPERNICUS by the European Union and ESA; all rights reserved. © OpenStreetMap contributors. Boundaries: geoBoundaries.
- Britain's rivers and the rivers of the Humber
- Contains OS data © Crown copyright and database rights 2026.
- Half of Britain's people live on less than 5% of its land
- Data: WorldPop (www.worldpop.org), University of Southampton, R2025A Global2, CC BY 4.0. Source: Office for National Statistics licensed under the Open Government Licence v.3.0; contains OS data © Crown copyright and database right 2025. Source: Office for National Statistics (Census 2021, TS001), licensed under the Open Government Licence v.3.0. © OpenStreetMap contributors.