Malaria in Uganda, 2000 to 2020: what modelled data shows, and what it can't
Modelled malaria incidence in Uganda fell from 503.7 to 260.1 per 1,000 people per year between 2000 and 2020; reconstructed totals did not fall in the same way. ATLAS, Spatial Nexus's AI research system, ran the study end to end. David Gardner is corresponding author.
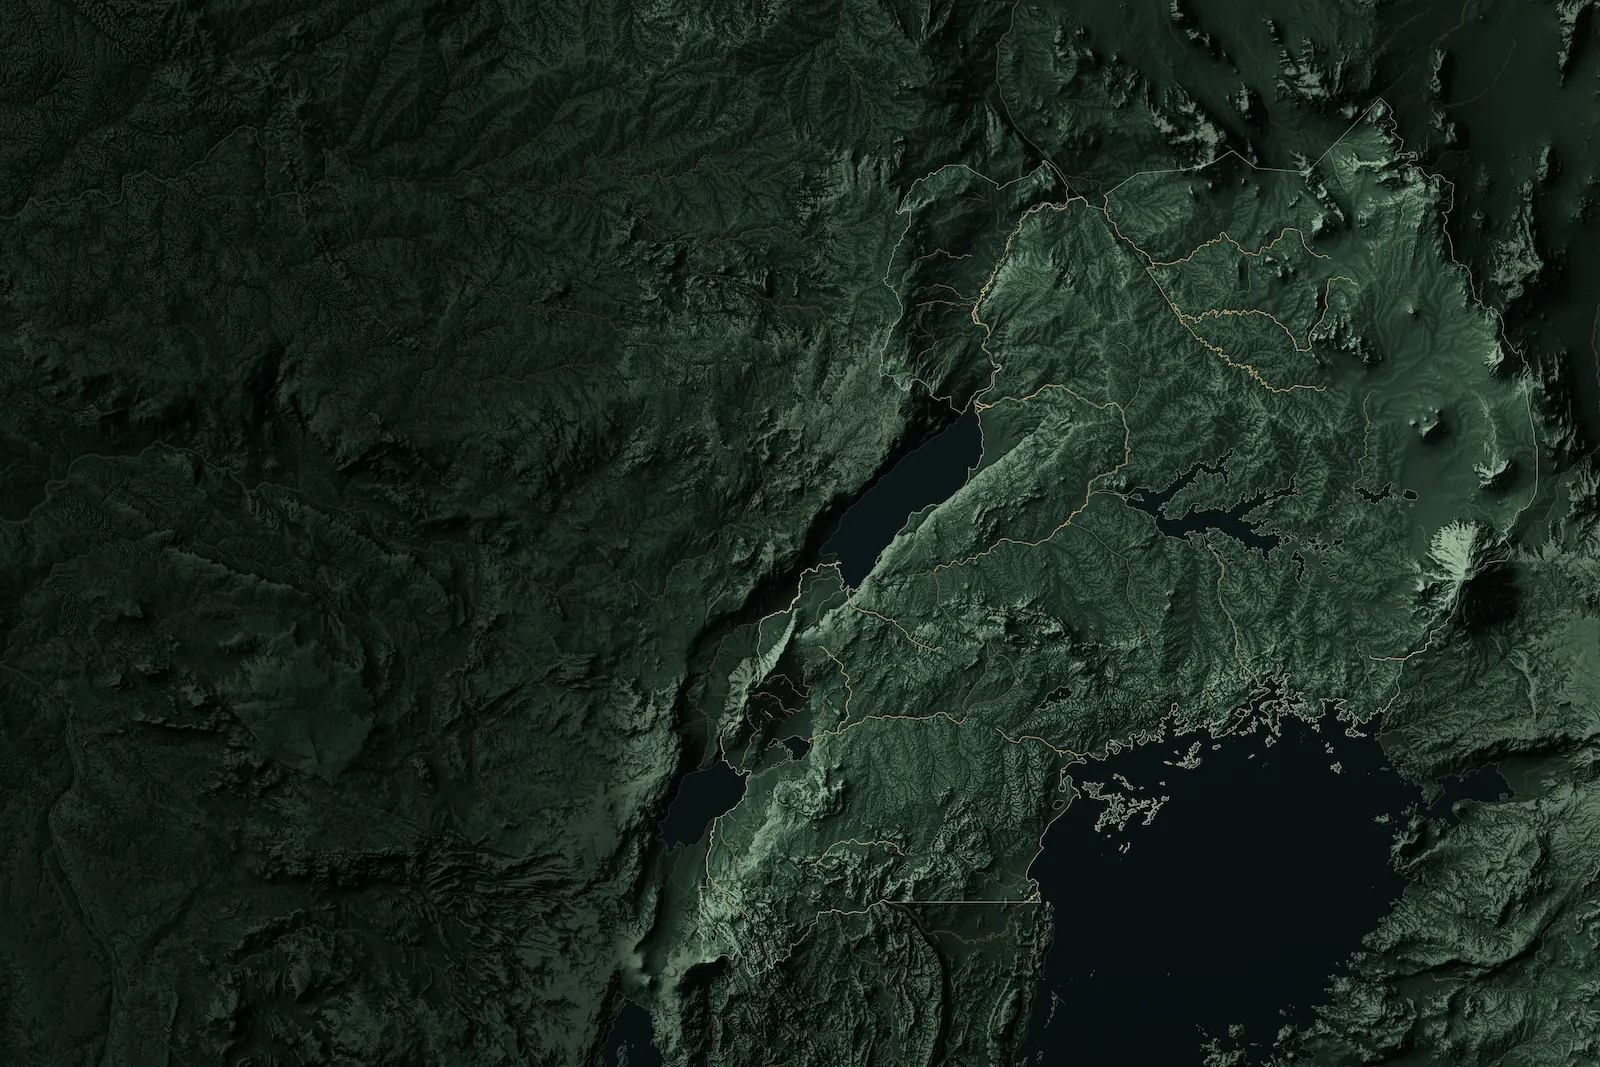
Uganda's terrain, drawn for this site. Data: Copernicus, OpenStreetMap
- Released:
- 13 October 2026 (version 1.0.0)
- Report:
- 26 pages, 9 figures, 43 citations
- Data:
- 16 public sources (15 used for results, listed below; one used only to cross-check units)
- Numbers re-checked before release:
- 286 of 286
I'm David Gardner, the study's corresponding author, and Spatial Nexus is my consultancy in Manchester, UK. You can hire it for analysis like this. See Spatial Nexus's services
Tell me about your project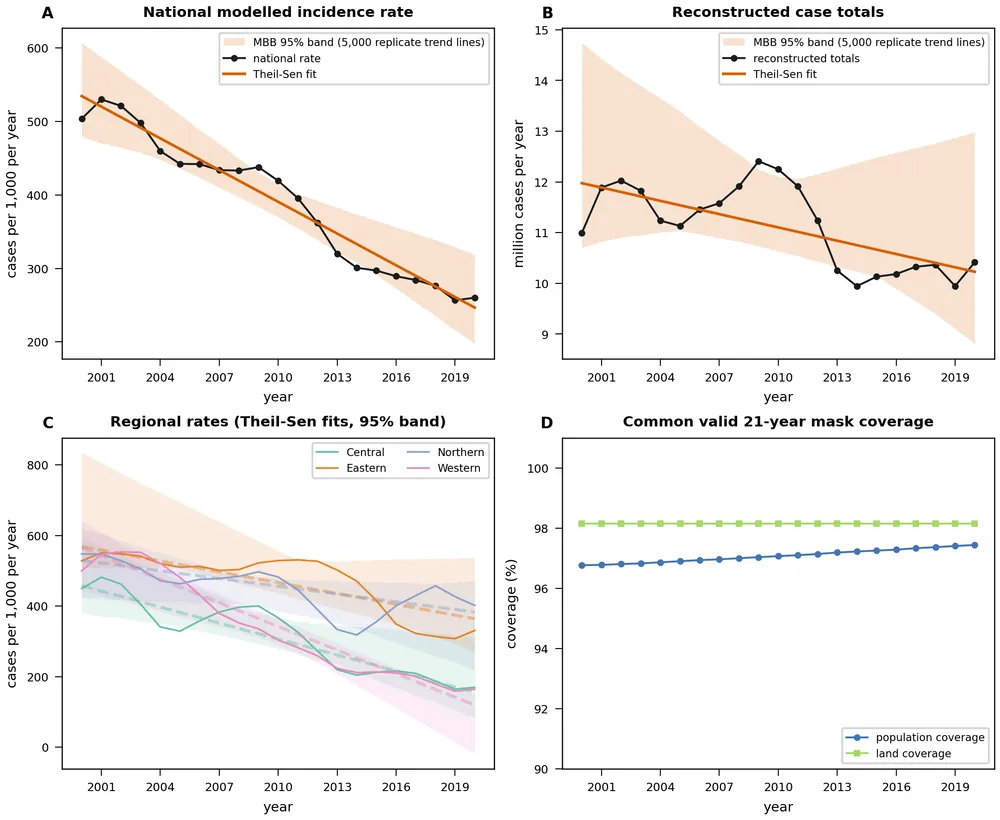
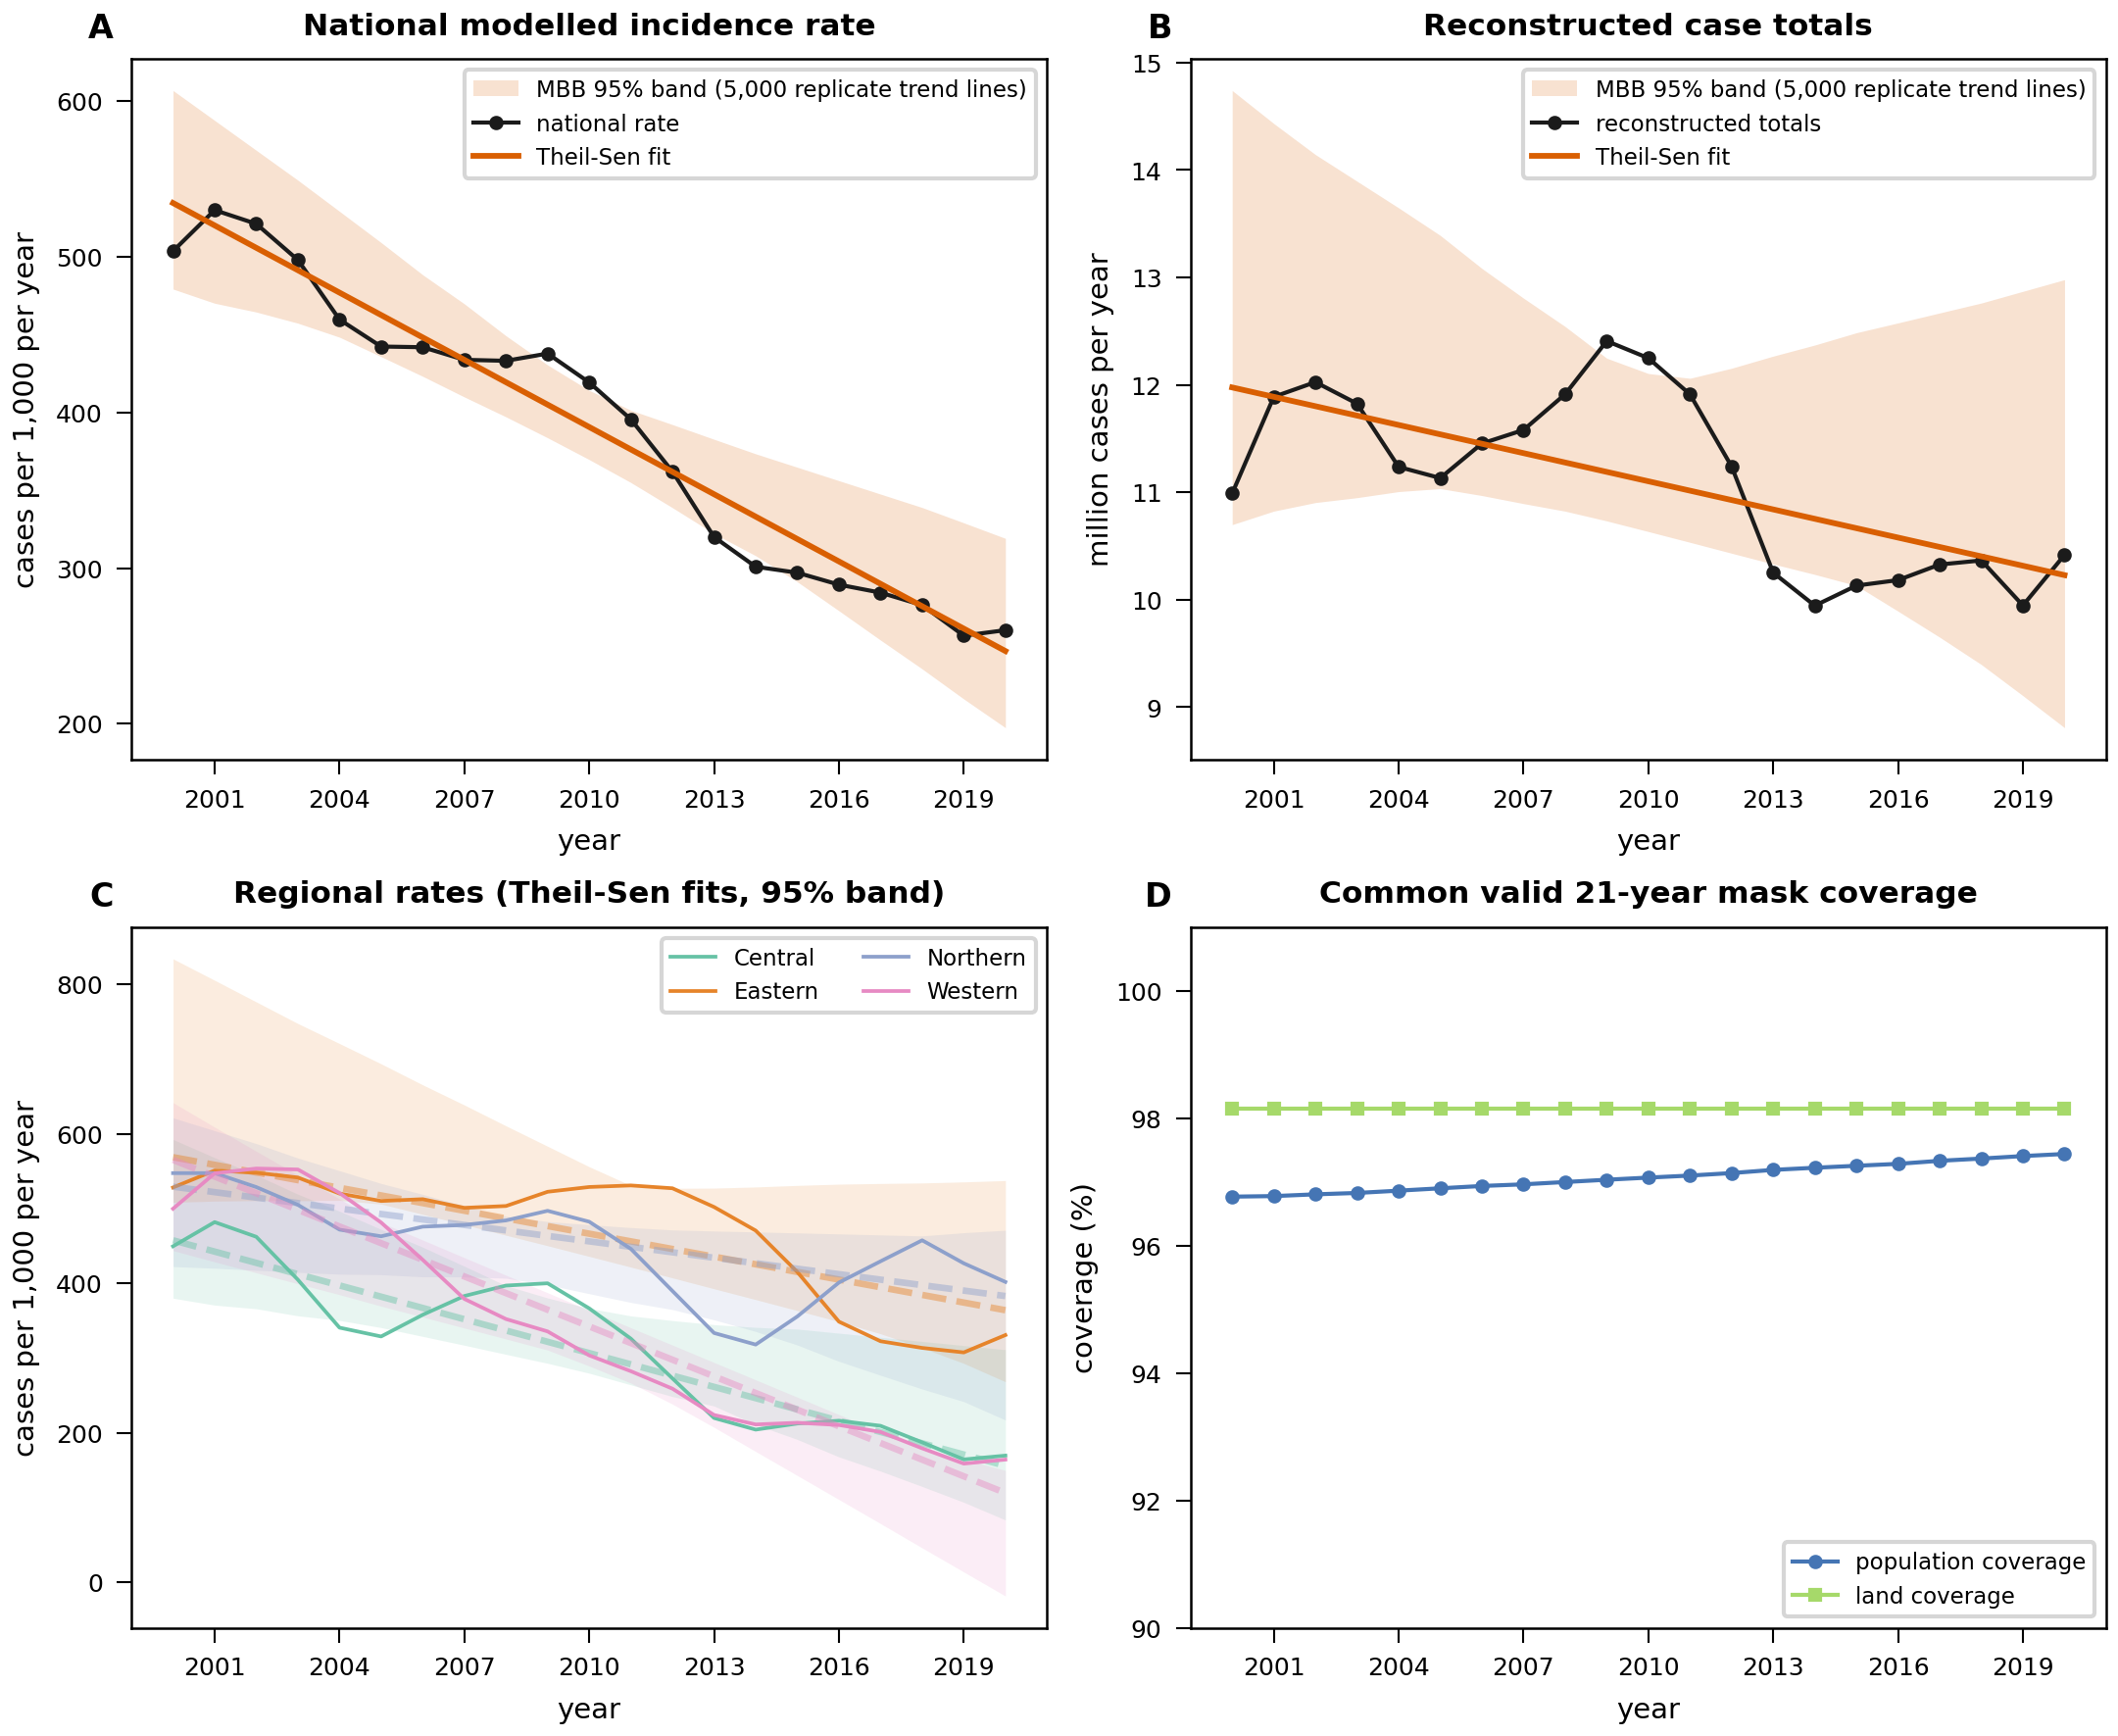
Modelled incidence and reconstructed totals, 2000 to 2020. Top: the national rate per 1,000 people per year, with a Theil–Sen trend line and a band showing the spread of 5,000 bootstrap trend lines. Then reconstructed totals, the four regions, and the share of the population the analysis covers (at least 96.8% in every year).
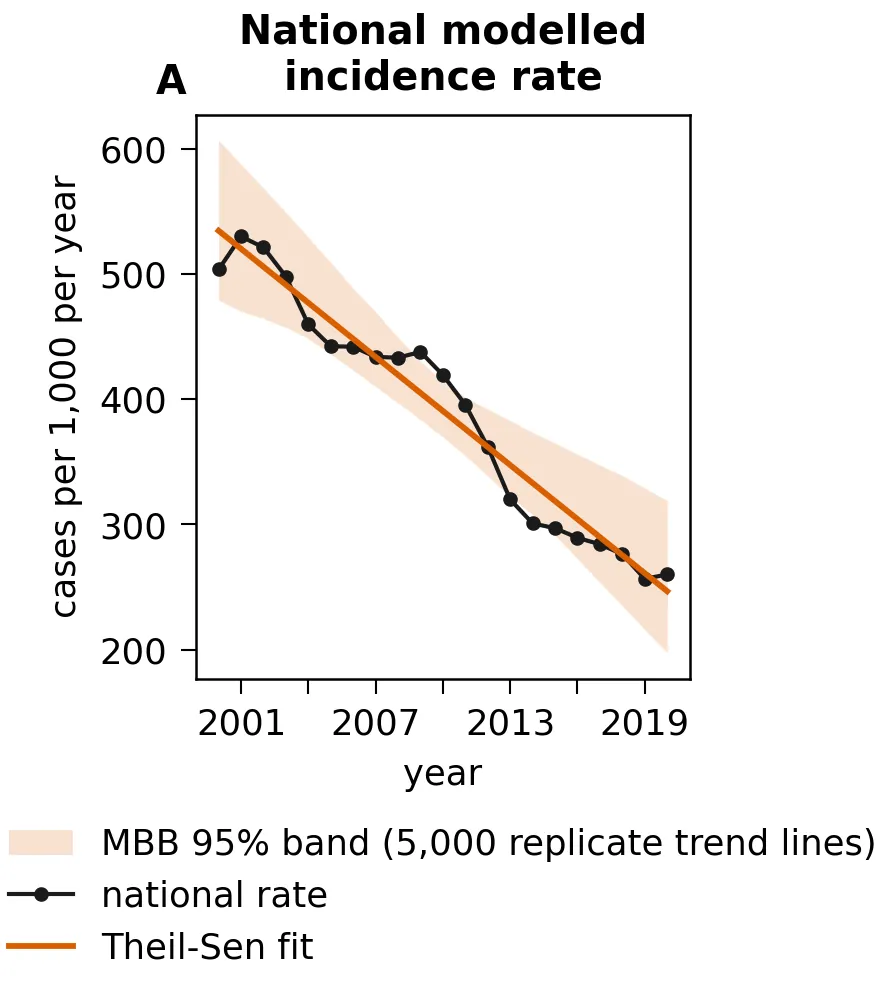
Modelled incidence, 2000 to 2020: the national rate per 1,000 people per year, with a Theil–Sen trend line and a band showing the spread of 5,000 bootstrap trend lines.
What did the study ask?
The study took one modelled picture of malaria in Uganda and asked five questions of it:
- How did malaria incidence change between 2000 and 2020, nationally and in each of the four regions?
- Where did hotspots persist across that period?
- How is incidence associated with temperature, distance to water and land cover?
- How could an environmental suitability score change by 2081 to 2100 under a high-emissions climate scenario?
- Can the public archive of mosquito records support a national model?
The outcome throughout is the Malaria Atlas Project's modelled incidence surface for Plasmodium falciparum (release 202608). It is a model built from surveillance and environmental data, not a count of people diagnosed.
Did modelled malaria incidence fall between 2000 and 2020?
Yes, as a rate. National modelled incidence, weighted by population, was 503.7 per 1,000 people per year in 2000 and 260.1 in 2020. The trend is -14.40 (95% CI -19.83 to -8.63) per 1,000 per year, and that interval excludes zero.
The total did not fall in the same way. Multiplying the rate by the population gives reconstructed totals, and their trend is -0.0874 million a year (95% CI -0.3073 to +0.1090), an interval that includes zero. The population grew while the rate fell, and in log terms the change splits into -0.661 from the rate and 0.607 from population, so population growth offset most of the fall.
The Western region fell fastest, at -22.28 (95% CI -32.92 to -14.73) per 1,000 per year, while the Eastern and Northern intervals include zero. In the Central region the trend is fragile: whether its interval excludes zero depends on a technical setting in the bootstrap, so the study does not call that decline significant.
A falling rate can hide what the total is doing, as it did here, and if your figures might do the same, that's work I can take on. Tell me about your project
Where does malaria persist?
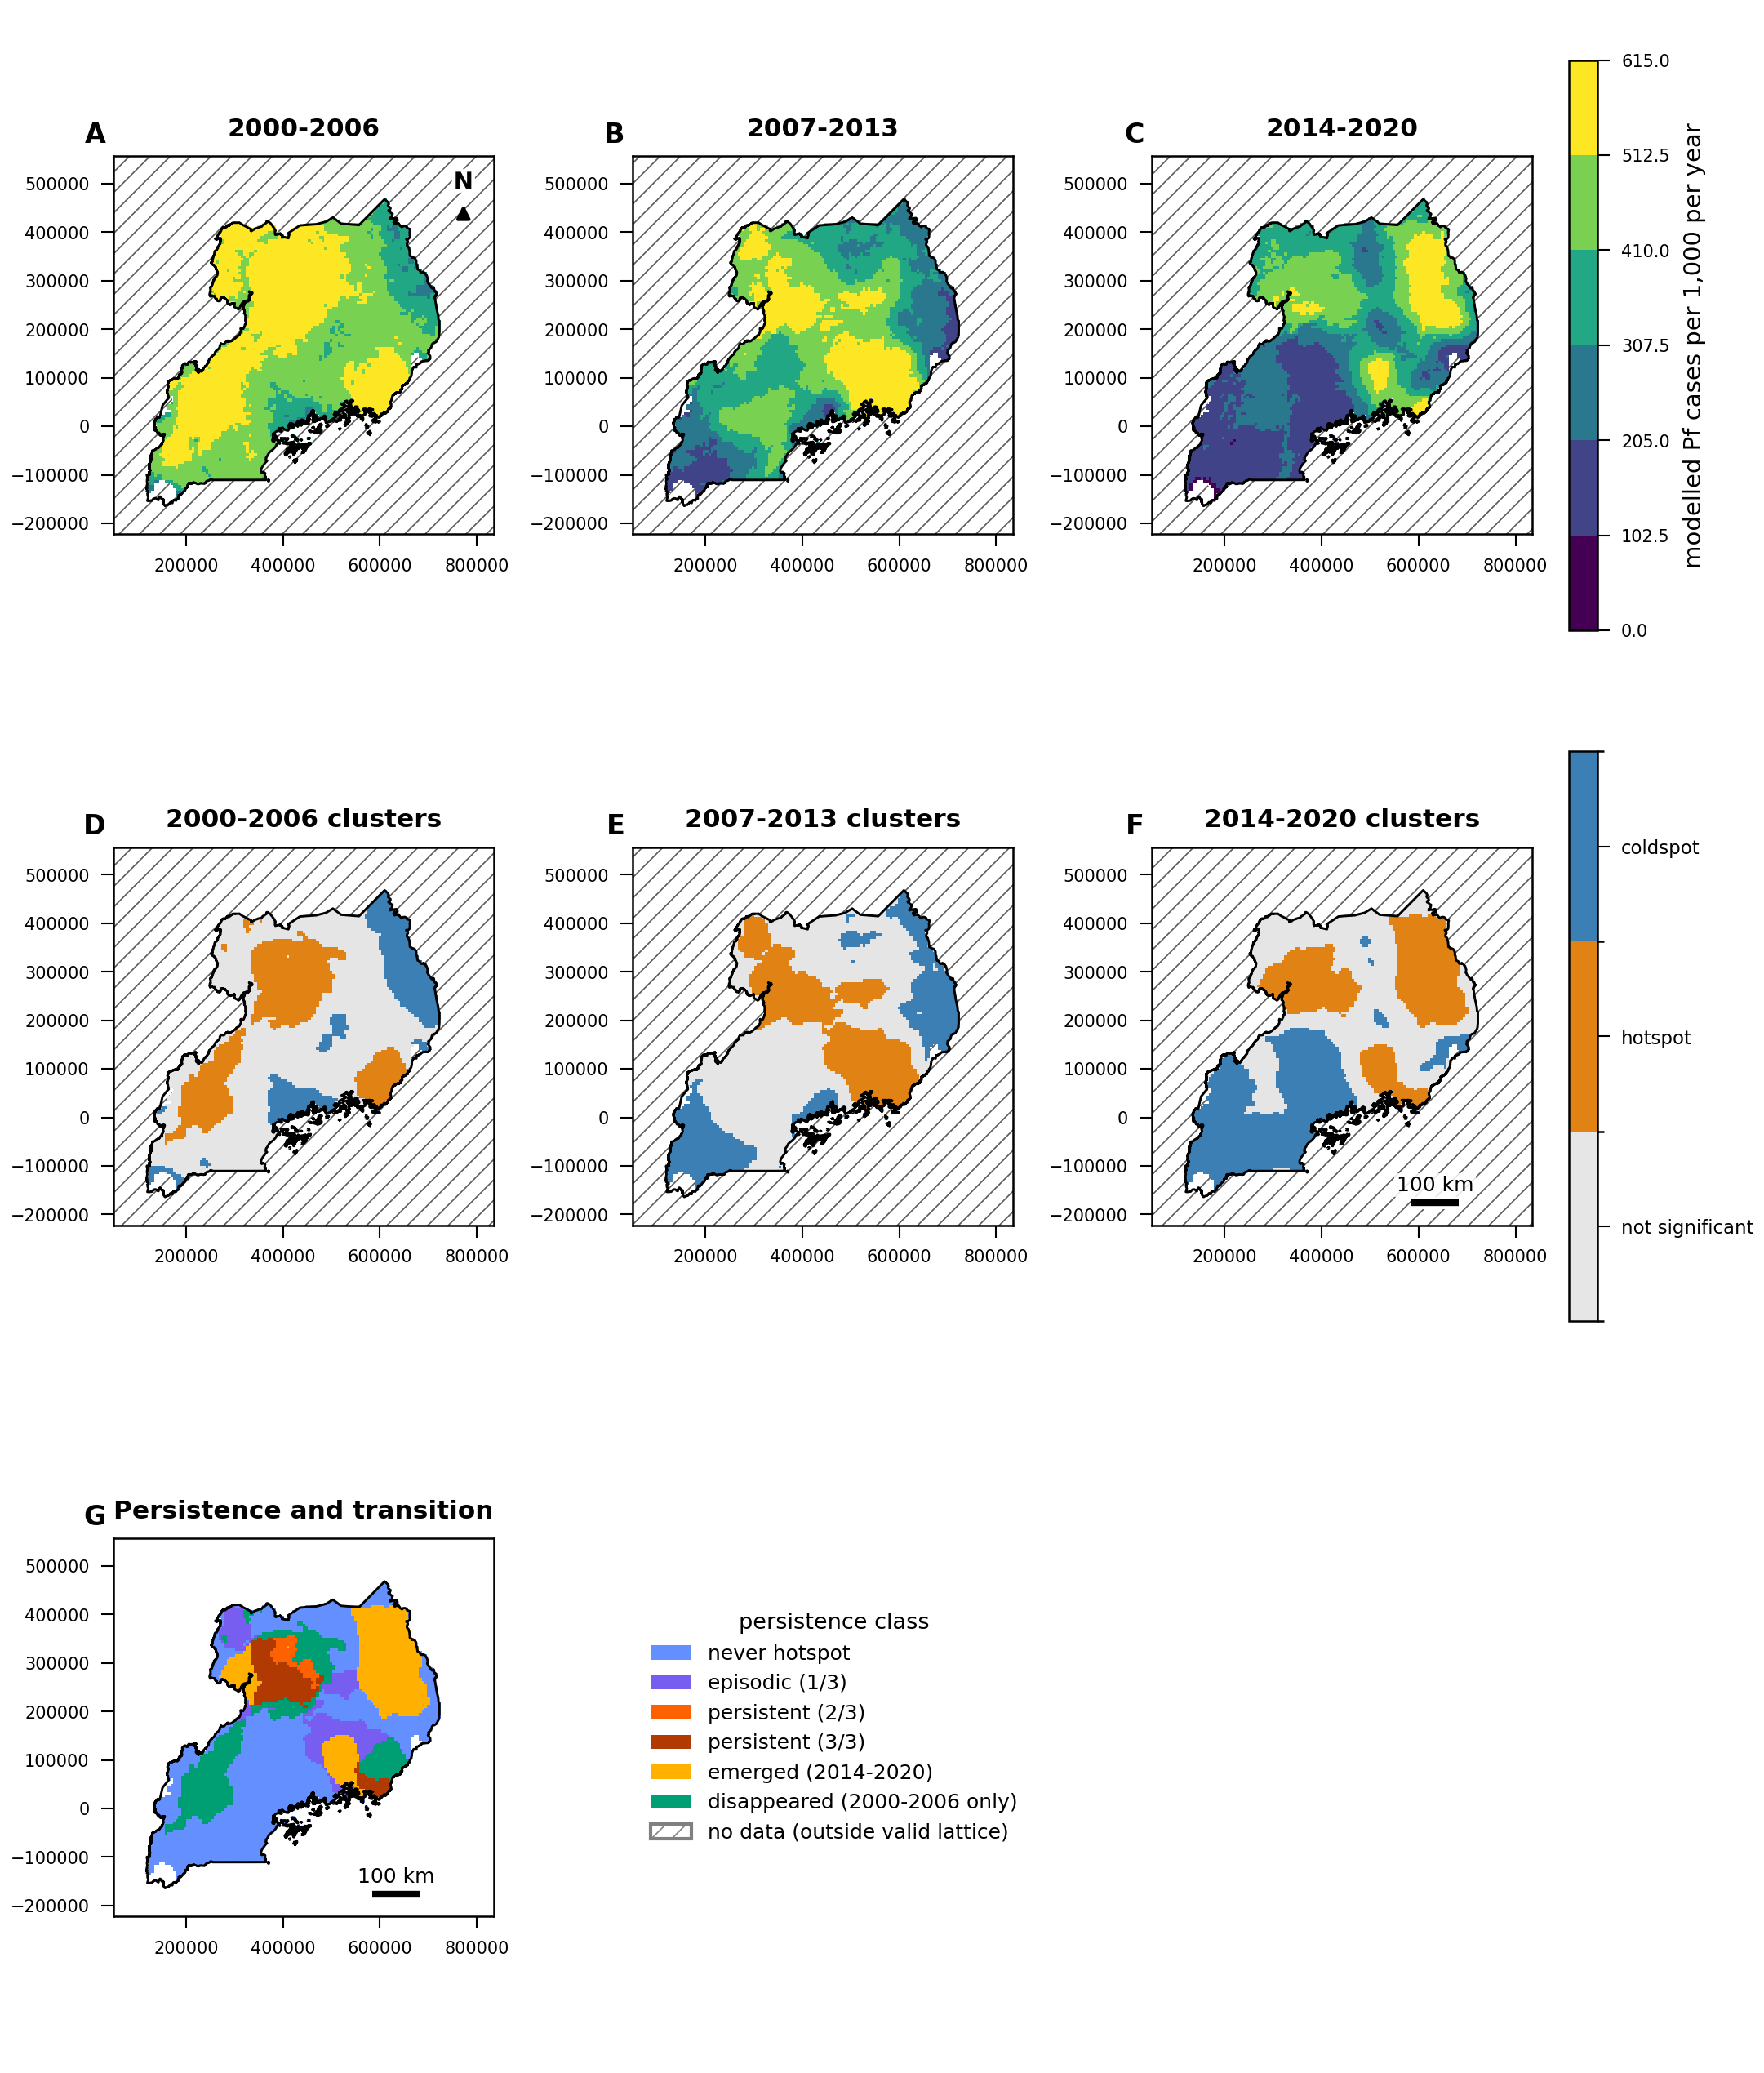
Mainly in the east and north. The study mapped hotspots in three periods, 2000 to 2006, 2007 to 2013 and 2014 to 2020. In at least two of those periods 1,196 grid cells were hotspots, and those are what the study calls persistent.
Persistent hotspots cover 26.00% of the land in the Eastern and Northern regions, against 7.52% in Central and Western: a difference of 18.48 percentage points (95% CI 4.46 to 30.98; one-sided permutation p = 0.0045). Measured by where people lived in 2020, the gap is wider: 40.49% against 4.17%.
The size of the gap depends on how neighbouring cells are defined, and if you count only cells that share an edge, it falls to 5.66 percentage points. The direction holds but the size is fragile, and the report says so.
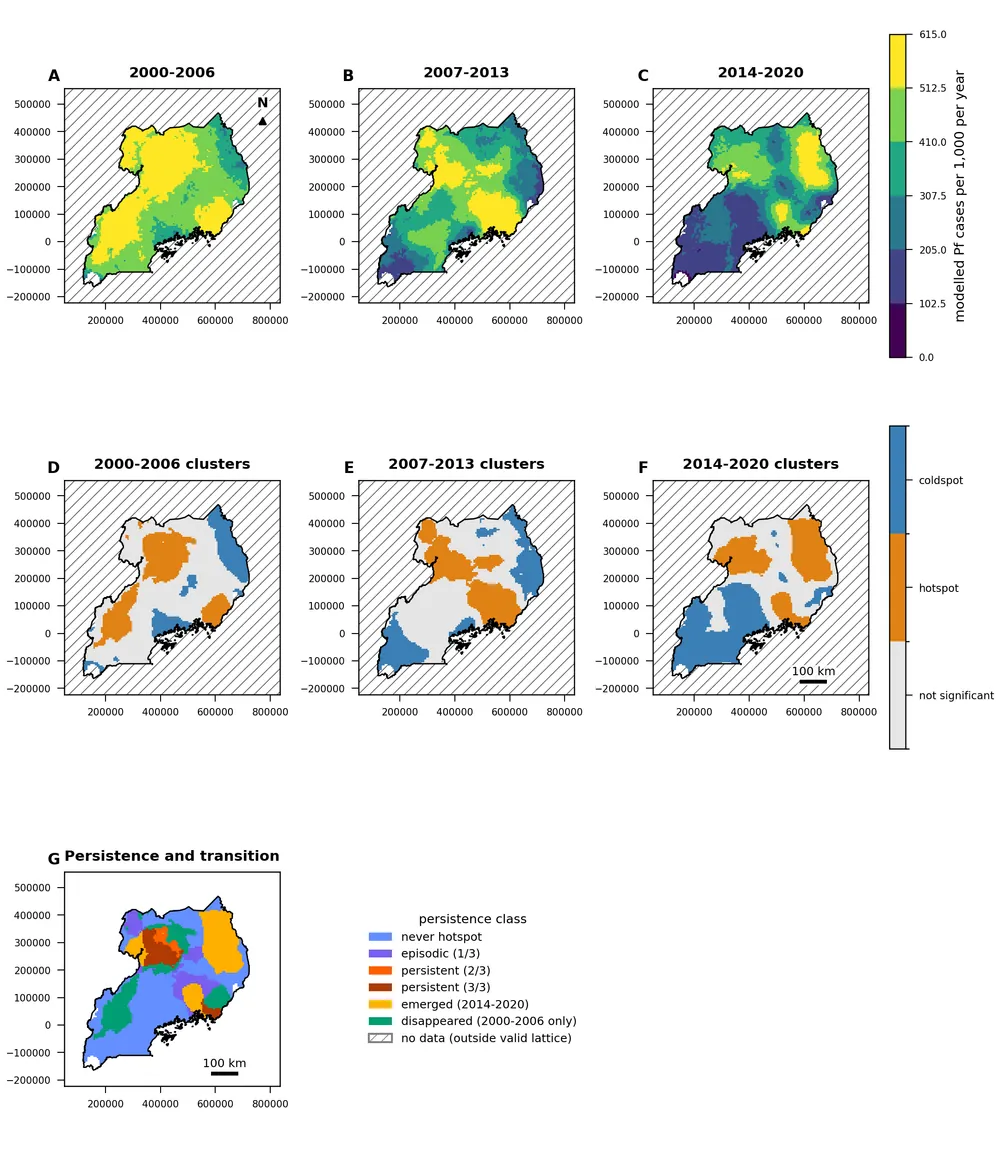
Modelled incidence averaged over three periods on one colour scale, the hotspots in each period, and where hotspots persisted, emerged or disappeared. Light grey: not a hotspot. White with hatching: no data.
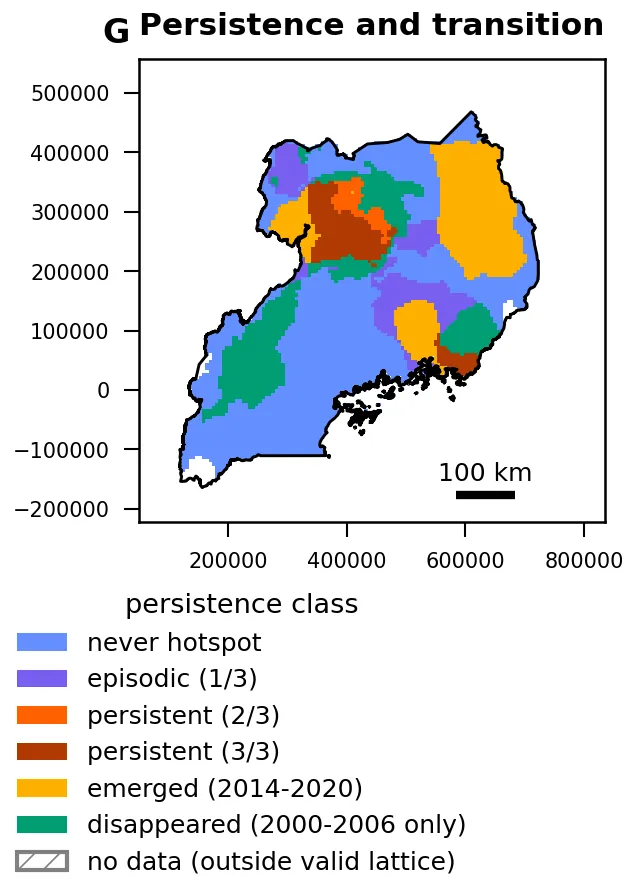
Where hotspots of modelled incidence persisted, emerged or disappeared, 2000 to 2020. Persistent means a hotspot in at least two of the three periods.
Do temperature, water or land cover explain the pattern?
Not in a way this study could separate. After adjusting for other factors:
- Temperature: no interior maximum identified. Incidence did not peak at any temperature inside the observed range; the highest point sat at its upper edge, 31.75 °C.
- Distance to water: 1.01 per km (95% CI 0.980 to 1.048). The interval includes no change, so the result is inconclusive.
- Land cover: no class differed from cropland once tested. Two land-cover products disagreed about grassland, so that result depends on which product you use.
These results are associational, and partly circular. The modelled incidence surface was itself built using temperature, rainfall, vegetation and land cover, so a quiet result here is not evidence that the environment doesn't matter.
If your results rest on one land-cover product or one choice of method, Spatial Nexus can rerun them with another and show you how far the answer moves. Tell me about your project
What might change by the end of the century?
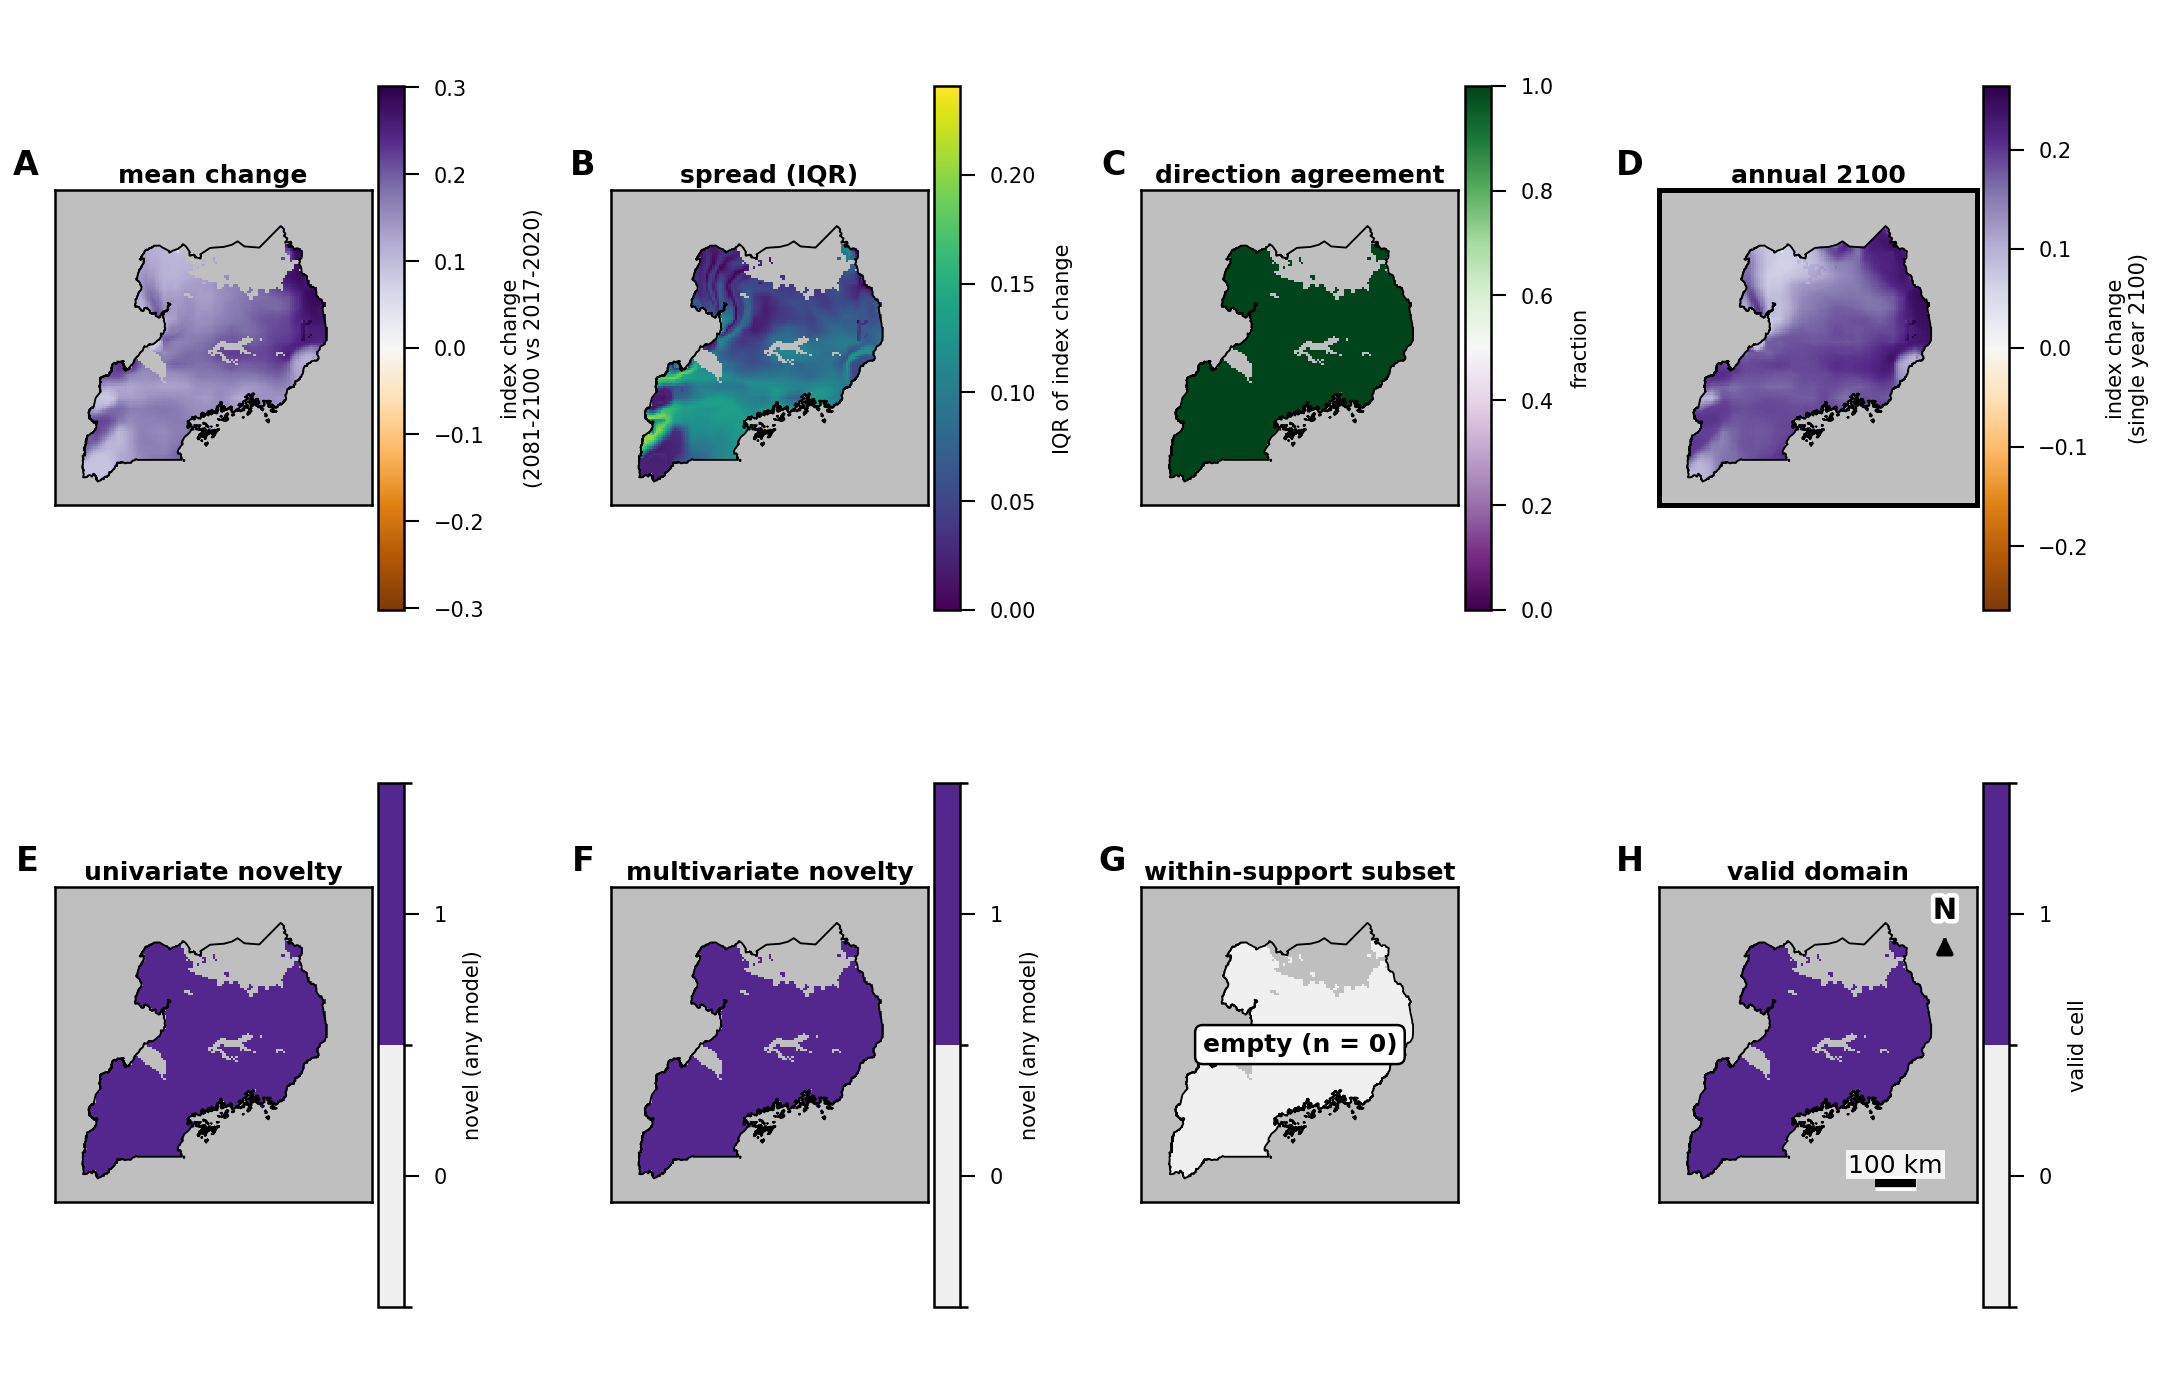
Under the high-emissions scenario SSP5-8.5, the study's environmental suitability score rises almost everywhere in Uganda by 2081 to 2100. The average change across five climate models is +0.1696 on a scale of 0 to 1, and all five models agree on the direction.
This is a scenario projection of an assumption-based score, not a forecast. The score combines temperature, humidity, rainfall and nearness to surface water with fixed weights chosen in advance. It is not a probability, and it says nothing about future malaria or mosquito numbers. In 2017 to 2020 no part of the country reached the score's high class in any season. By 2081 to 2100 every mapped cell has left the range of conditions seen in 2017 to 2020, so the projection can't be compared with present-day conditions anywhere in the country.
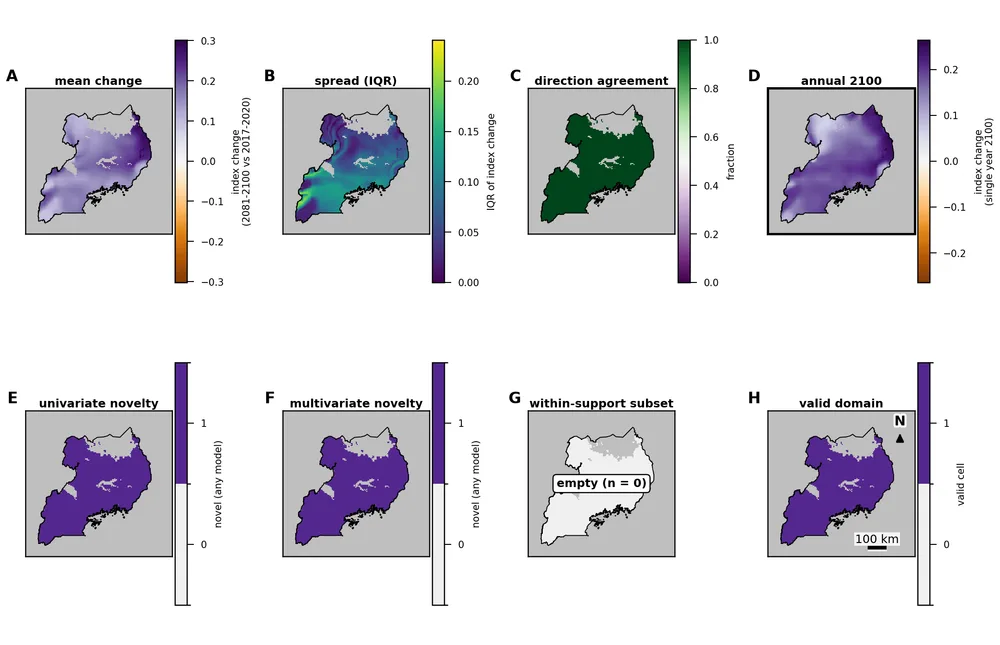
Change in the suitability score, 2081 to 2100 against 2017 to 2020, under SSP5-8.5: the average of five climate models, the spread between them, where they agree on direction, and where conditions leave the observed range. A separate panel shows the single year 2100. The grey band in the north has no observed baseline data. A scenario projection, not a forecast.
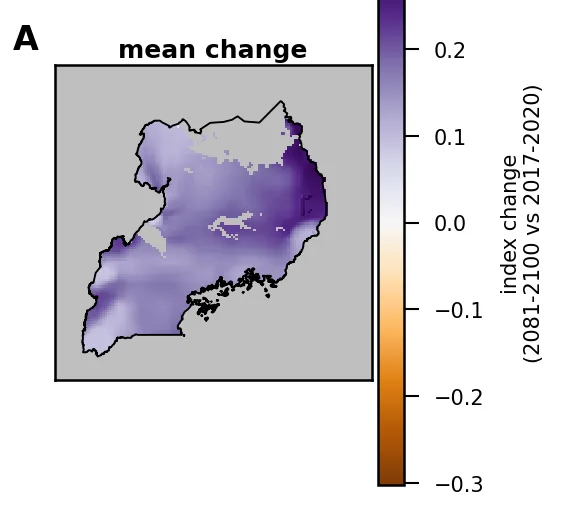
Change in the suitability score, 2081 to 2100 against 2017 to 2020, under SSP5-8.5: the average of five climate models. The grey band in the north has no observed baseline data. A scenario projection, not a forecast.
What could the data not support?
The main one is a national model of mosquito records. The public archive for 2017 to 2020 held 4,929 downloaded records, but after screening dates and removing duplicates, 689 observation events remained, from 3 locations in 3 grid cells. Before any analysis, the study had set a minimum of 20 occupied cells, so the model was not fitted, and the report shows coverage and counts instead. Bear in mind that the archive records where people sampled, not where mosquitoes are, so an empty cell means no records, not no mosquitoes.
One planned land-cover comparison, using a satellite source that hit its usage quota, was withdrawn before any analysis. It is flagged for a follow-up study and is not counted as a negative result.
The report sets out 12 limitations in full, including the circularity described above and the fact that the incidence results describe a modelled surface, not observed illness.
If you're not sure your data can answer your question, tell me what you have, and if it can't, I'll tell you and show why. Tell me about your project
How was the study produced?
ATLAS ran the study end to end, from acquiring the data to assembling the report. I approved its scope, its data-use conditions and its release, and I take responsibility for its content.
These rules applied throughout:
- The questions, methods and decision rules were fixed before any results were seen. Every later change is recorded as a numbered amendment.
- Every analysis step was registered before it ran, with a fixed random seed, so the results can be reproduced.
- Every number shown in the report was re-derived from the analysis outputs and matched: 286 of 286.
- All 43 citations were verified.
- The figures were checked for layout faults, and the methods audit passed with no open finding.
The methods were Theil–Sen trends with block-bootstrap intervals; Getis–Ord Gi* hotspot mapping; generalised additive models; inverse-distance interpolation checks; and five CMIP6 climate models adjusted to observed 2017 to 2020 climate.
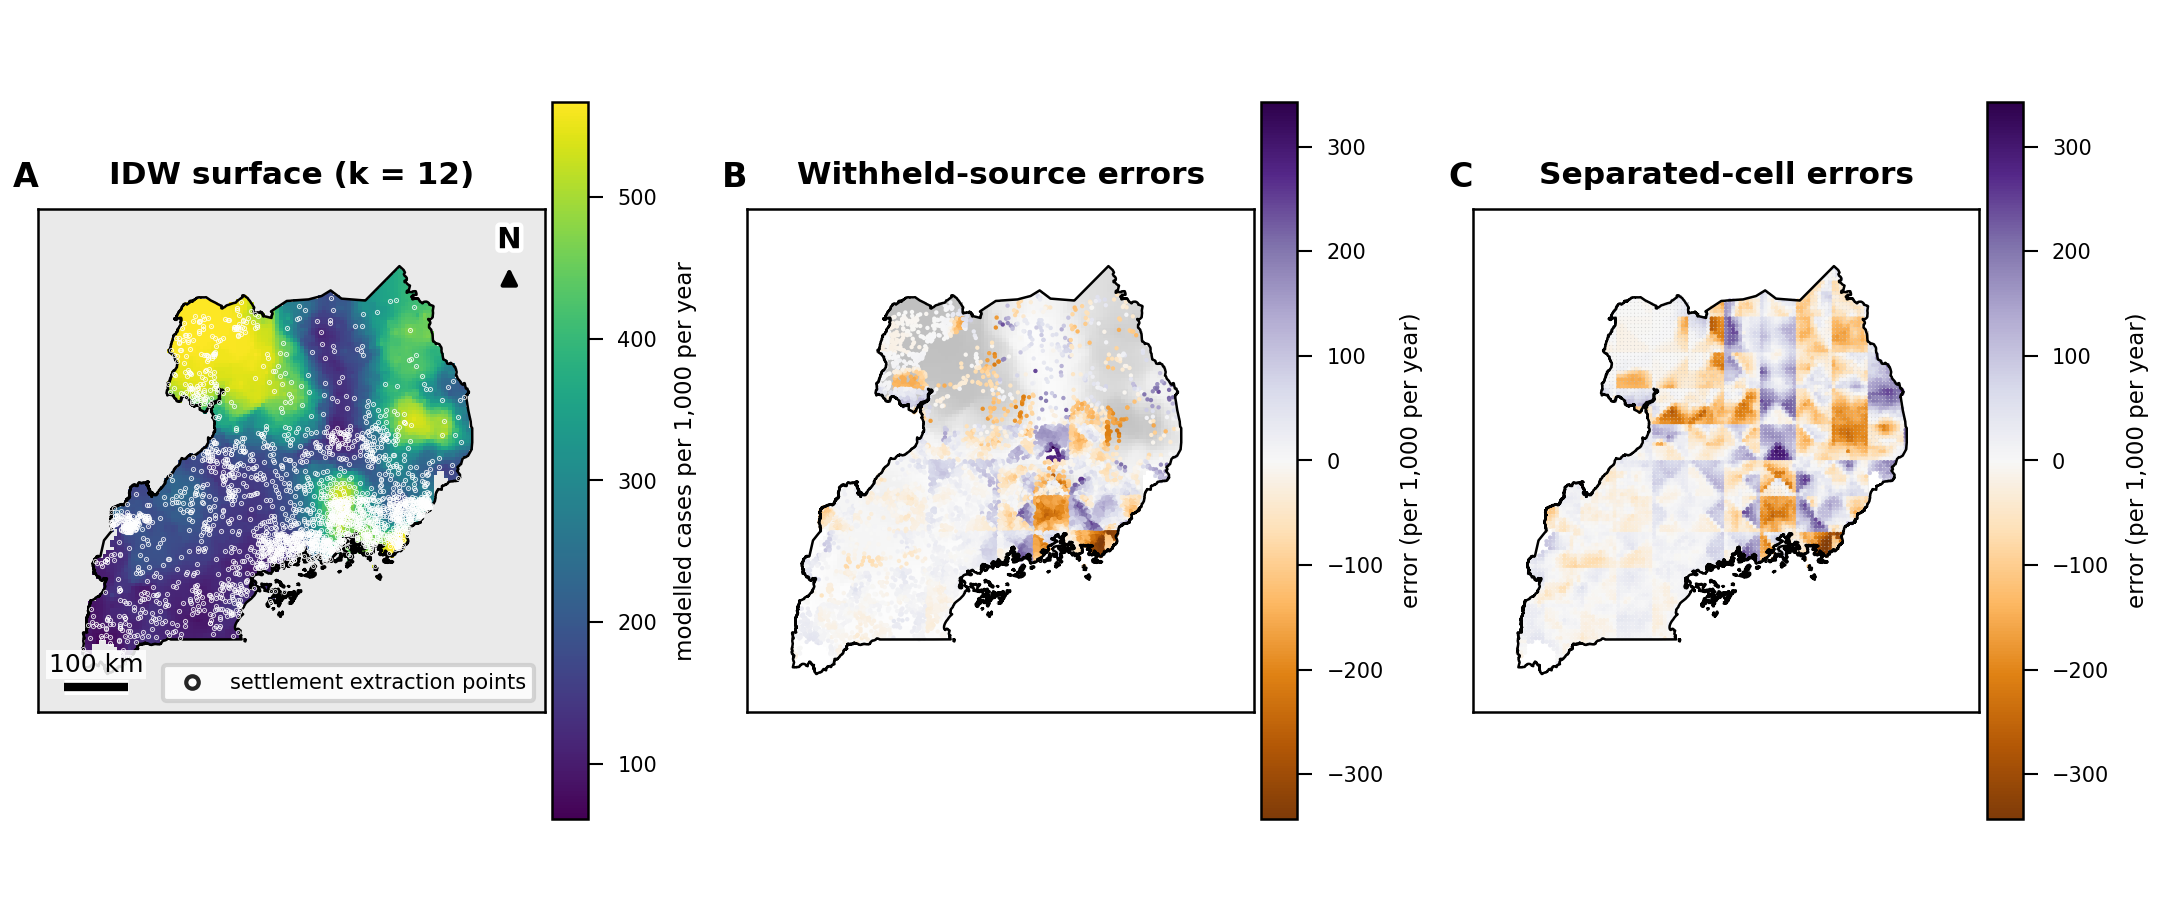
As one check, the study rebuilt its own 2020 map from 11,112 settlement locations by simple interpolation, then measured the error at cells away from any settlement. That error (root-mean-square) was 84.7 per 1,000 (95% CI 73.9 to 95.2). It shows how much of a national map is data and how much is filled in between.
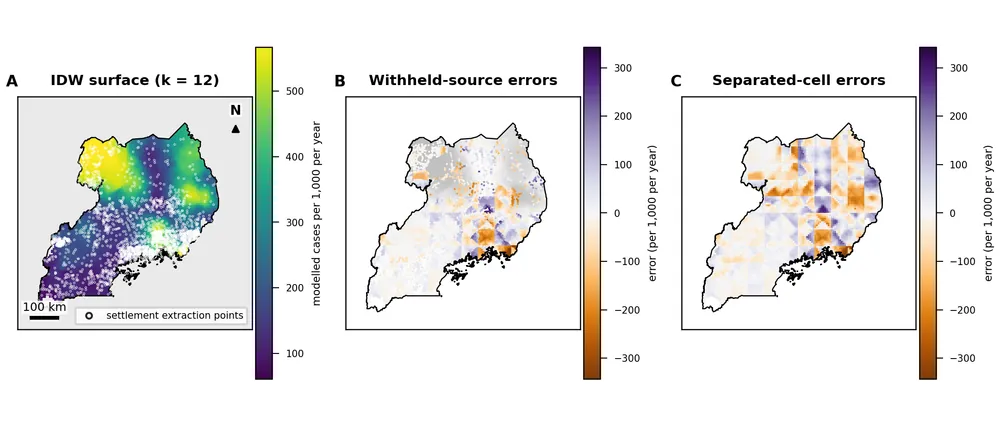
Interpolation check of the modelled 2020 surface: rebuilt from settlement locations and compared with the original, with errors mapped at withheld settlements and at cells away from any settlement. This checks how well the surface can be rebuilt, not the incidence data itself. Settlements are reference points, not observations.
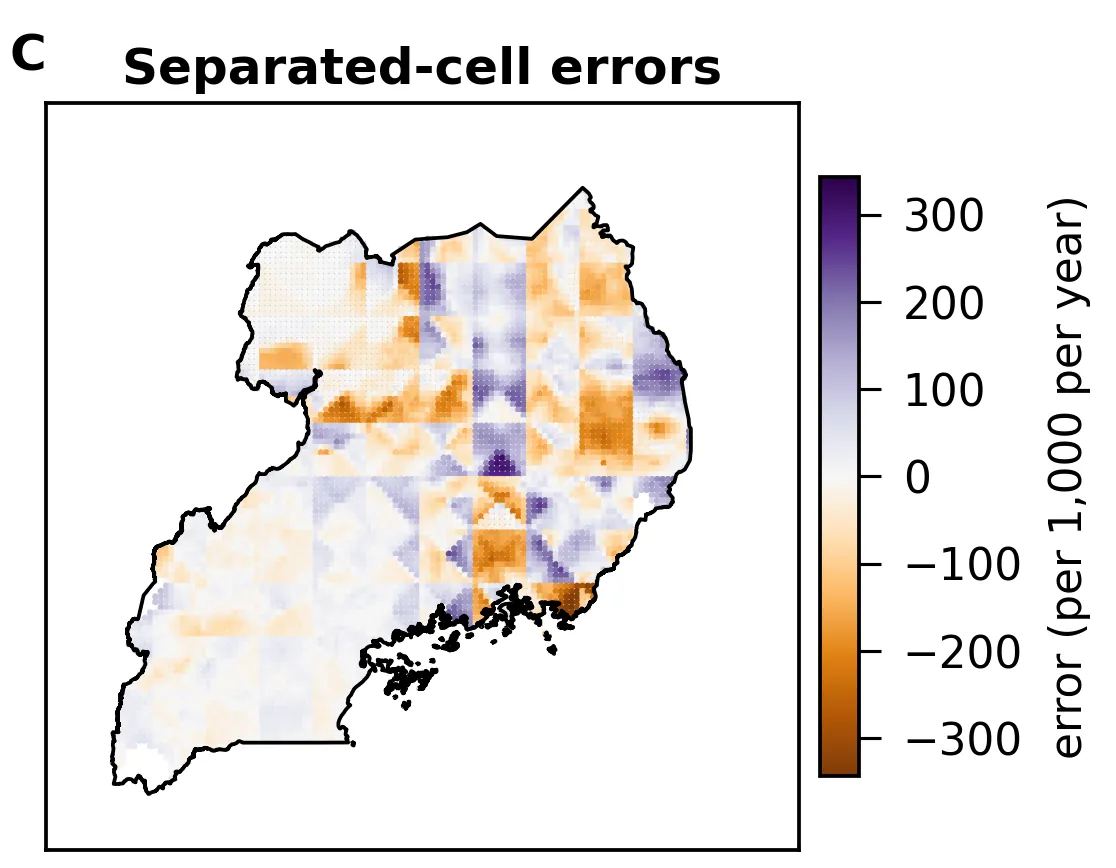
Errors at cells away from any settlement, when the modelled 2020 surface was rebuilt from settlement locations. This checks how well the surface can be rebuilt, not the incidence data itself.
Your own analysis could be run this way too, with the rules agreed first and each number traced back to its source.
Tell me about your projectCan I read the full report?
The 26-page study report was released on 13 October 2026, but it isn't available to download at the moment. Its main findings, their uncertainty and its limits are here instead, and the numbers in them are the report's own.
Data sources and licences
The study drew on 16 public sources. The 15 that its results rest on are listed here; the 16th was used only to cross-check units, and no number on this page comes from it. The full list, with versions and dates, is in the report.
- Malaria Atlas Project, P. falciparum clinical incidence, annual surfaces 2000 to 2020, release 202608 (data.malariaatlas.org). Malaria Atlas Project. Number of newly diagnosed Plasmodium falciparum cases per 1,000 population, on a given year, release 202608. https://data.malariaatlas.org. Accessed 10 October 2026. Licensed under CC BY 3.0.
- WorldPop Global Project population, 100 m, 2000 and 2020 (CC BY 4.0, WorldPop, University of Southampton). WorldPop does not endorse this work.
- GLDAS-2.1 Noah (public domain, NASA GES DISC).
- CHIRPS v2.0 daily rainfall (open with attribution, Climate Hazards Center, UC Santa Barbara).
- ESA CCI land cover, Africa 2016 (CC BY 3.0); MODIS MCD12Q1 land cover (public domain, NASA LP DAAC); ESA WorldCover v100 (CC BY 4.0).
- Landsat 8 Collection 2 Level-2 (public domain, USGS/NASA).
- JRC Global Surface Water v1.4 (CC BY 4.0, European Commission Joint Research Centre).
- OpenStreetMap Uganda extract via Geofabrik (© OpenStreetMap contributors, ODbL 1.0).
- SRTM elevation (public domain, NASA/USGS).
- GeoNames populated places (CC BY 4.0).
- geoBoundaries Uganda, 2017 (ODbL 1.0).
- NASA NEX-GDDP-CMIP6, SSP5-8.5 (CC BY 4.0).
- Mosquito records: GBIF.org occurrence download, doi.org/10.15468/dl.m4me68, from the VectorBase dataset (CC BY-NC 4.0). This page reports counts only and shows no records or maps from it.

Sources and credits
- Uganda's terrain
- Produced using Copernicus WorldDEM-90 © DLR e.V. 2010-2014 and © Airbus Defence and Space GmbH 2014-2018 provided under COPERNICUS by the European Union and ESA; all rights reserved. © OpenStreetMap contributors. Boundaries: geoBoundaries.
- Britain's rivers and the rivers of the Humber
- Contains OS data © Crown copyright and database rights 2026.